Or try one of the following: 詹姆斯.com, adult swim, Afterdawn, Ajaxian, Andy Budd, Ask a Ninja, AtomEnabled.org, BBC News, BBC Arabic, BBC China, BBC Russia, Brent Simmons, Channel Frederator, CNN, Digg, Diggnation, Flickr, Google News, Google Video, Harvard Law, Hebrew Language, InfoWorld, iTunes, Japanese Language, Korean Language, mir.aculo.us, Movie Trailers, Newspond, Nick Bradbury, OK/Cancel, OS News, Phil Ringnalda, Photoshop Videocast, reddit, Romanian Language, Russian Language, Ryan Parman, Traditional Chinese Language, Technorati, Tim Bray, TUAW, TVgasm, UNEASYsilence, Web 2.0 Show, Windows Vista Blog, XKCD, Yahoo! News, You Tube, Zeldman
JRebel Enterprise speeds configuration, code updates for cloud-based Java development | InfoWorld
Technology insight for the enterpriseJRebel Enterprise speeds configuration, code updates for cloud-based Java development 20 Aug 2025, 10:22 pm
Perforce Software has introduced JRebel Enterprise, software that promises to accelerate the configuration of cloud-based Java development environments, and that enables incremental code changes to Java applications, eliminating the need to redeploy entire applications for every change, the company said.
Announced August 19, JRebel Enterprise skips Java application redeploys for minor code changes and automatically configures Java environments to support changing Java development environments at enterprise scale, Perforce said. JRebel Enterprise offers the same capabilities of the JRebel code deployment tool, but is optimized for containerized, cloud environments, Perforce said.
JRebel Enterprise enables developers to seamlessly push code changes to remote environments without the need for lengthy rebuilds and redeploys, said Jeff Michael, Perforce’s senior director of product management, in a statement. The company said that, according to its 2025 Java Productivity Report published March 4, 73% of enterprise respondents use cloud-based or remote development environments. But increased complexities in these environments can result in additional challenges for companies searching for development tools to ensure compatibility and efficiency within their own infrastructure. JRebel Enterprise both eliminates redeploys—the time needed to make a change in Java code and see the change reflected in the resulting environment—and eliminates frequent developer-level reconfiguration for cloud environments brought on by dynamic Java development environments, Perforce said.
JRebel Enterprise includes the following features:
- Accelerated cloud configuration from three to five minutes per server, per developer, to a one-time, one- to two-minute configuration for an entire Java development team.
- Automatic detection and configuration of JRebel agents running on JVMs.
- Support for Java 21 and newer versions and integration with the JetBrains IntelliJ IDEA integrated development environment.
- Support for cloud providers including Amazon Web Services, Google Cloud Platform, and Microsoft Azure.
AWS blames bug for Kiro pricing glitch that drained developer limits 20 Aug 2025, 11:42 am
AWS has blamed a bug for all usage and pricing-related issues that developers have been facing on Kiro, its new agentic AI-driven integrated development environment (IDE), since it introduced a revised pricing structure last week.
“As we have dug into this, we have discovered that we introduced a bug when we rolled out pricing in Kiro, where some tasks are inaccurately consuming multiple requests. That’s causing people to burn through their limits much faster than expected,” Adnan Ijaz, director of product management for Agentic AI at AWS, posted on Kiro’s official Discord channel.
Further, Ijaz wrote that AWS was “actively” working to fix the issue in order to provide a resolution within a couple of days.
Pricing flip-flops and developer dissatisfaction
In July, AWS had to limit the usage of Kiro, just days after announcing it in public preview, due to the sheer number of developers flocking to try out the IDE, mainly driven by pricing changes and throttling issues in rival IDEs, such as Cursor and Claude Code.
It had also retracted details of the pricing tiers it planned for the service. AWS initially said it would offer three tiers of service for Kiro: free with a cap of 50 agentic interactions per month; Pro at $19 per month for up to 1,000 interactions, and Pro+ at $39 per month for up to 3,000 interactions.
However, last week, it introduced a revised pricing structure moving away from simple interactions to vibe and spec requests: free with a cap of 50 vibe and 0 spec requests; Pro at $20 with 225 vibe and 125 spec requests, Pro+ at $40 with 450 vibe and 250 spec requests; and Power at $200 for 2,250 vibe and 1,250 spec requests.
Any use that breaches these limits in the paid tiers is to be charged at $0.04 per vibe and $0.20 per spec request, AWS said.
The vibe and spec-driven pricing structure, which is unique to Kiro, did not go down well with developers, with several of them taking to social media and varied forums to express their disappointment.
Several users also took to Kiro’s GitHub page to raise concerns that the limits of the various pricing tiers were getting exhausted quickly, rendering the IDE unusable.
A GitHub user reported the issue of accelerated limit exhaustion as a bug. Another GitHub user reported that a large amount of vibe credits were being consumed even when the user didn’t actively engage in any conversation.
Reminiscent of Cursor’s episode from June
Many users are comparing Kiro’s pricing changes with Cursor’s pricing changes introduced in June, which left developers confused and dissatisfied.
Post the pricing change, several took to social media platforms, such as Reddit, to express their dissatisfaction and state that they were looking at alternatives as their cost of usage on the same plan had increased dramatically.
Although Cursor has attempted to clarify its Pro plan and has offered full refunds for surprise charges incurred between June 16 and July 4, many developers are still not clear on the changes in the plan.
Some had even sought clarity on the company’s official forum page, which also then housed several posts showing dissatisfaction among its users
AWS, too, is currently offering to reset limits for any users impacted by the bug.
Kiro to be anyways more expensive than other IDEs?
Despite the dissatisfaction among users and developers, analysts see Kiro driving more value when compared to rivals.
Kiro’s advantage over rivals, according to Moor Insights and Strategy principal analyst Jason Andersen, is rooted in its spec-driven approach, wherein a developer defines the entire application or task rather than conventional chat-oriented code generation or code reviews.
The spec-driven approach is also the primary reason behind Kiro being more expensive when compared to rivals, especially in request consumption, Andersen said.
“Spec-driven development can spawn many tasks simultaneously, so what appears as a single spec request actually may be many requests rolled into one. And since these requests are more complex, they ultimately use more GPU inference, hence more requests and a higher cost per request,” Andersen explained.
Further, Andersen sees the spec-driven development strategy as an effective playbook for AWS to disrupt rivals with the added condition that it educates developers.
“AWS came up with this split pricing model so they could offer a vibe toolset that was price-competitive and a price for spec that was reflective of its more powerful nature, which in turn uses a lot more resources. This was a sincere attempt to address the market conditions,” Andersen said.
However, he also pointed out that AWS should provide some insights or benchmarks for what a developer can expect when it comes to using spec-driven development.
Your code is more strongly coupled than you think 20 Aug 2025, 11:00 am
In previous articles I introduced connascence—the idea that code coupling can be described and quantified—and discussed five kinds of static connascence. In this article, we’ll wrap up our tour of connascence with a discussion of the deeper kind of connascence, dynamic connascence.
Dynamic connascence is visible only at runtime. Because it’s discovered late and it’s often non-local, dynamic connascence usually represents stronger coupling than static forms.
Connascence of execution
Connascence of execution occurs when code must execute in a certain order for the system to function correctly. It is often referred to as “temporal coupling.” Here is a simple example:
userRecord.FirstName = 'Alicia';
userRecord.LastName = 'Florrick';
userManager.addUser(userRecord);
userRecord.Birthday = new Date(1968, 6, 24);
This code adds the Birthday value after the user has been added. This clearly won’t work. This mistake can be caught by examining the code, but a more complex scenario could be harder to spot.
Consider this code:
sprocketProcessor.AddSprocket(SomeSprocket);
sprocketProcessor.ValidateSprocket();
Does the order of those two statements matter? Does the sprocket need to be added and then validated, or should it be validated before it is added? What happens if the sprocket doesn’t validate? It is hard to say, and someone not well-versed in the system might make the mistake of putting them in the wrong order. That is connascence of execution.
If you ever see a comment along the lines of, “This line of code MUST BE EXECUTED BEFORE the one below!!!!!”, then the developer before you probably ran into a problem caused by connascence of execution. The exclamation points tell you the error wasn’t easy to find.
The key question: Would reordering lines of code break behavior? If so, then you have connascence of execution.
Connascence of timing
Connascence of timing occurs when the timing of execution makes a difference in the outcome of the application. The most obvious example of this is a threaded race condition, where two threads pursue the same resource, and only one of the threads can win the race.
Connascence of timing is notoriously difficult to find and diagnose, and it can reveal itself in unpredictable ways. Anyone who has delved deeply into debugging thread problems is all too aware of connascence of timing.
The key question: Would changing thread scheduling, network latency, or a timeout alter correctness? Then you have connascence of timing.
Connascence of value
Connascence of value occurs when several values must be properly coordinated between modules. For instance, imagine you have a unit test that looks like this:
[Test]
procedure TestCheckoutValue {
  PriceScanner = new TPriceScanner();
  PriceScanner.Scan('Frosted Sugar Bombs');
  Assert.Equals(50, PriceScanner.CurrentBalance);
}
So we’ve written the test. Now, in the spirit of Test Driven Development, I’ll make the test pass as easily and simply as possible.
void PriceScanner.Scan(aItem: string) {
  CurrentBalance = 50;
}
We now have tight coupling between TPriceScanner and our test. We obviously have connascence of name, because both classes rely on the name CurrentBalance. But that’s relatively low-level connascence, and perfectly acceptable. We have connascence of type, because both must agree on the type TPriceScanner, but again, that’s benign. And we have connascence of meaning, because both routines have a hard-coded dependency on the number 50. That should be refactored.
But the real problem is the connascence of value that occurs because both of the classes know the price—that is, the “value”—of Frosted Sugar Bombs. If the price changes, even our very simple test will break.
The solution is to refactor to a lower level of connascence. The first thing you could do is to refactor so that the price (the value) of Frosted Sugar Bombs is maintained in only one place:
void TPriceScanner.Scan(aItem: string; aPrice: integer) {
  currentBalance := currentBalance + aPrice;
}
Now our test can read as follows:
[Test]
void TestCheckoutValue {
  PriceScanner = new TPriceScanner;
  PriceScanner.Scan('Frosted Sugar Bombs', 50);
}
As a result, we no longer have connascence of value between the two modules, and our test still passes. The price is reflected in only one place, and any price will work for our test. Excellent.
The key question: Do multiple places need updating when a constant or a configuration setting changes? If so, then you have connascence of value.
Connascence of identity
Connascence of identity occurs when two components must refer to the same object. If the two components refer to the same object, and one changes that reference, then the other component must change to the same reference. This, too, is a subtle and difficult-to-detect form of connascence. In fact, connascence of identity is the most complex form of connascence.
As an example, consider the following code:
class ReportInfo {
  private _reportStuff = "";

  get reportStuff(): string {
    return this._reportStuff;
  }

  set reportStuff(value: string) {
    this._reportStuff = value;
  }
}

class InventoryReport {
  constructor(public reportInfo: ReportInfo) {}
}

class SalesReport {
  constructor(public reportInfo: ReportInfo) {}
}

function main(): void {
  const reportInfo = new ReportInfo();
  reportInfo.reportStuff = "Initial shared info";

  const inventoryReport = new InventoryReport(reportInfo);
  const salesReport = new SalesReport(reportInfo);

  // Do stuff with reports...
  console.log("Initially shared object?",
    inventoryReport.reportInfo === salesReport.reportInfo); // true

  // Change one side to point at a new identity
  const newReportInfo = new ReportInfo();
  newReportInfo.reportStuff = "New info for inventory only";
  inventoryReport.reportInfo = newReportInfo;

  // Now they refer to different ReportInfo instances (Connascence of Identity risk)
  console.log("Still shared after reassignment?",
    inventoryReport.reportInfo === salesReport.reportInfo); // false

  // Observable divergence
  console.log("Inventory.reportInfo.reportStuff:", inventoryReport.reportInfo.reportStuff);
  console.log("Sales.reportInfo.reportStuff:", salesReport.reportInfo.reportStuff);
}

main();
Here we have two reports, an inventory report and a sales report. The domain requires that the two reports always refer to the same instance of ReportInfo. However, as you can see in the code above, in the middle of the reporting process, the inventory report gets a new ReportInfo instance. This is fine, but the sales report must refer to this new ReportInfo instance as well.
In other words, if you change the reference in one report, then you must change it in the other report for the system to continue working correctly. This is called connascence of identity, as the two classes depend on the same identity of the reference.
The above example is simple to be sure, but it’s not hard to conceive of a situation where the references change in unknown or obfuscated ways, with unexpected results.
The key question: Must two components always point to the same instance? Then you have connascence of identity.
Okay, so there we have it—the four kinds of dynamic connascence. Now, I’ll be the first to admit that this connascence stuff is quite nerdy and a little hard to understand. But much of it covers coding issues you already intuitively knew but perhaps never considered in a formal way. How many types of connascence are wrapped up in the “Don’t repeat yourself” (DIY) principle?
All I know is that I don’t like heavily coupled code, and anything I can learn that helps me avoid it isn’t too nerdy for me.
Is the generative AI bubble about to burst? 20 Aug 2025, 11:00 am
One way to measure the scope of the generative AI boom is financially, and another is in terms of public awareness. Both are nearly unprecedented, even in the realm of high tech. Data center build-outs in support of AI expansion are expected to be in the region of $364 Billion in 2025—an amount that makes the cloud “revolution” look more like an aperitif.
Beyond the charm and utility of chatbots, the AGI (artificial general intelligence) concept is the main driver of public attention. Many believe we are on the cusp of an explosion of compute power that will change history.
If the promise of AGI is one pole of the field in public perception of AI, the opposite pole is that generative AI is largely a stochastic hat trick. Some rather well-informed parties have pointed out the inherent limitations in the way large language models are built. In short, LLMs have certain drawbacks that cannot be mitigated by increasing the size of the models.
Somewhere between the two poles lies the truth. Because we are already using these tools in our daily work, software developers know better than most where AI tools shine and where they fall apart. Now is a great moment to reflect on the state of the AI boom from our position on its leading edge.
Rhymes with dotcom
In 2001, I was a junior engineer at a dotcom startup. I was walking through the familiar maze of cubicles one day when a passing thought froze me: “Is this a bubble?”
Now, I wasn’t especially prescient. I didn’t have a particular grasp of the economics or even the overall technology landscape. I was just glad to be programming for money. But there was something about the weird blend of college dorm and high tech, of carefree confidence and easy history-making, that caught my attention.
There was a palpable sense that “everything was different now.” We were in this bright new era where the limits on expansion had been overcome. All we had to do was continue exploring new possibilities as they opened before us. The ultimate apotheosis of tech married to finance was guaranteed, so long as we maintained enthusiasm.
Does any of this sound familiar to you?
Learning (or not) from the dotcom bust
Early this year, Goldman Sachs released a study comparing the dotcom tech boom to AI today. The study notes fundamental ways the current moment differs from the dotcom era, especially in the profits reaped by big tech. In essence, the “Magnificent 7” tech companies are pulling in AI-generated revenue that, according to Sachs, justifies the mental and financial extravagance of the moment.
“We continue to believe that the technology sector is not in a bubble,” says the report, because “while enthusiasm for technology stocks has risen sharply in recent years, this has not represented a bubble because the price appreciation has been justified by strong profit fundamentals.”
So, that’s the bullish case from the investment point of view. (For another view, the New Yorker recently published another comparison of the current AI boom and that of the dotcom era.)
The AI money trap
We don’t have to look far for a more contrarian perspective. Economist Paul Kedrosky, for one, notes that capital expenditure on data centers has driven 1.2% of national GDP, acting as a kind of stimulus program. Without that investment, he writes, the US economy would be in contraction.
Kedrosky describes an “AI datacenter spending program” that is “already larger than peak telecom spending (as a percentage of GDP) during the dot-com era, and within shouting distance of peak 19th century railroad infrastructure spending.”
Virtually all AI spend flows into Nvidia in one way or another. This is reflected in its recent valuation as the first publicly traded company to break $4 trillion in market capitalization (second up was Microsoft).
To put that number in context, market observers such as Forbes described it as being greater than the GDP of Canada or the annual global spending on defense.
Nvidia alone accounts for more than 7% of the value of the S&P 500. AI gadfly Ed Zitron calls it the “AI money trap.”
What developers know
Here’s where I believe programmers and others who use AI tools have an advantage. We are the early adopters, par excellence. We are also, as typical coders, quick to call it like it is. We won’t fudge if reality doesn’t live up to the promise.
Code generation is currently the killer app of AI. But for developers, that flavor of AI assistance is already turning stale. We’re already looking for the next frontier, be it agentic AI, infrastructure, or process automation.
The reality is that AI is useful for development, but continues to exhibit many shortcomings. if you’re using it for work, you get a visceral sense for that balance. AI sometimes delivers incredible, time-saving insights and content. But then it will just as confidently introduce an inaccuracy or regression that eats up all the time it’s just saved you.
I think most developers have realized quickly that modern AI is more of a useful tool than a world-changing revelation. It won’t be tearing the roof off of traditional development practice anytime soon.
The limitations of LLMs
There is a growing ripple effect as developers realize we are basically doing what can be done with AI, while the industry presses forward as if there were an almost insatiable demand for more.
As an example, consider the sobering rumination from Gary Marcus, a longtime observer of AI, in a recent post dissecting the rather lackluster launch of ChatGPT 5. Looking into the heart of modern AI design, he identifies inherent shortcomings that cannot be addressed by increasing the availability of compute power and data. (His alternative architecture, Neurosymbolic AI, is worth a look.)
Marcus also references a recent report from Arizona State University, which delves into chain of thought (CoT) reasoning and the limitations of LLMs to perform inference. This is a structural limitation also highlighted in the June 2025 position paper from Apple, The Illusion of Thinking.
The basic message is that LLMs, when they appear to be reasoning, are actually just reflecting the patterns in their data, without the ability to generalize. According to this line of thought, what we see is what we get with LLMs; how they have worked in the last few years is what they are capable of—at least, without a thoroughgoing re-architecture.
If that is true, then we can expect a continuation of the incremental gains we are seeing now, even after throwing trillions worth of data center infrastructure at AI. Some unpredictable breakthroughs may occur, but they’ll be more in the realm of potential than predictable, based on the existing facts on the ground.
What if AI is a bubble?
Artificial intelligence is a legitimately exciting new sphere of technology, and it is producing a massive build-out. But if the hype extends too far beyond what reality can support, it will contract in the other direction. The organizations and ideas that survive that round of culling will be the ones capable of supporting enduring growth.
This happened with Blockchain. It went big, and some of those riding its expansion exploded spectacularly. Consider FTX, which lost some $8 billion in customer funds, or the Terra collapse, which is tough to fully quantify but included at least $35 billion lost in a single day. And these are just two examples among many.
However, many of the companies and projects that survived the crypto winter are now pillars of the crypto ecosystem, which is becoming ever more integrated directly into mainstream finance.
The same thing may be true of the current AI trend: Even if the bubble pops spectacularly, there will be survivors. And those survivors will promote lasting AI-driven changes. Some of the big tech companies at the forefront of AI are survivors of the dotcom collapse, after all.
In a recent interview with The Verge, OpenAI’s Sam Altman noted that, “When bubbles happen, smart people get overexcited about a kernel of truth. Are we in a phase where investors as a whole are overexcited about AI? My opinion is yes. Is AI the most important thing to happen in a very long time? My opinion is also yes.”
What do you think? As a software developer using AI in your work, are we in a bubble? If so, how big is it, and how long before it is corrected?
PyApp: An easy way to package Python apps as executables 20 Aug 2025, 11:00 am
Every developer knows how hard it is to redistribute a Python program as a self-contained, click-and-run package. There are third-party solutions, but they all have drawbacks. PyInstaller, the oldest and best-known tool for this job, is crotchety to work with and requires a fair amount of trial-and-error to get a working redistributable. Nuitka, a more recent project, compiles Python programs to redistributable binaries, but the resulting artifacts can be massive and take a long time to produce.
A newer project, PyApp, takes an entirely different approach. It’s a Rust program you compile from source, along with information about the Python project you want to distribute. The result is a self-contained binary that, when run, unpacks your project into a directory and executes it from there. The end user doesn’t need to have Python on their system to use it.
Setting up PyApp
Unlike other Python distribution solutions, PyApp is not a Python library like PyInstaller. It’s also not a standalone program that takes in your program and generates an artifact from it. Instead, you create a custom build of PyApp for each Python program you want to distribute.
You’ll need to take care of a few prerequisites before using PyApp to deploy Python programs:
- PyApp’s source: Make a clone of PyApp’s source and put it in a directory by itself, separate from any other projects.
- The Rust compiler and any other needed infrastructure: If you’re unfamiliar with Rust or its tooling, you’ll need to understand at least enough of it to compile a Rust program from source. Check out my tutorial for getting started with Rust to see what you need.
- Your Python program, packaged as a wheel: The “wheel,” or .
whlfile, is the binary format used to package Python programs along with any platform-specific components (such as precompiled libraries). If you don’t already have a wheel for the Python program you want to repackage, you’ll need to generate one. My video tutorial for creating Python wheels steps you through that process. You can also use wheels hosted on PyPI.
PyApp uses environment variables during the build process to figure out what Python project you want to compile into it and how to support it. The following variables are the ones most commonly used:
- PYAPP_PROJECT_NAME: Used to define the name of the Python project you’ll be bundling. If you used
pyproject.tomlto define your project, it should match theproject.nameattribute. This can also be the name of a project on PyPI; if not, you will want to define the path to the.whlfile to use. - PYAPP_PROJECT_VERSION: Use this to configure a specific version of the project if needed.
- PYAPP_PROJECT_PATH: The path (relative or absolute) to the
.whlfile you’ll use for your project. Omit this if you’re just installing a.whlfrom PyPI. - PYAPP_EXEC_MODULE: Many Python packages run automatically in some form when run as a module. This variable lets you declare which module to use, so if your program runs with
thisprogram, you’d set this variable to:python -m thisprogram. - PYAPP_EXEC_SPEC: For programs that have an entry-point script, you can specify it here. This matches the syntax in the
project.scriptssection ofpyproject.toml. For instance,pyprogram.cmd:mainwould import the modulepyprogram.cmdfrom your Python program’s modules, then execute the functionmain()from it. - PYAPP_EXEC_SCRIPT: This variable lets you supply a path to an arbitrary Python script, which is then embedded in the binary and executed at startup.
- PYAPP_DISTRIBUTION_EMBED: Normally, when you create a PyApp binary, it downloads the needed Python distribution to run your program from the Internet when it’s first executed. If you set this variable to
1, PyApp will pre-package the needed Python distribution in the generated binary. The result is a larger binary, but one that doesn’t need to download anything; it can just unpack itself and go.
Many other options are available, but these should be enough for most projects you want to build.
To make things easy on yourself, you may want to create a shell script for each project that sets up these environment variables and runs the compilation process.
Building the PyApp binary
Once you’ve set the environment variables, go to the root directory of PyApp’s source, and build PyApp using the Rust compiler with the command:
cargo build --release
This might take several minutes, as PyApp has many dependencies (363 as of this writing). Future compilation passes will take much less time, though, once Rust obtains and caches everything.
Note that while it’s possible to cross-compile for other platforms, it is not recommended or supported.
Once the compiling is done, the resulting binary will be in the target/release subdirectory of the PyApp project directory, as pyapp.exe. You can rename the resulting file anything you want, as long as it’s still an executable.
Running the PyApp binary
To test the binary, just run it from a console. If all is well, you should see prompts in the console as PyApp unpacks itself and prepares to run. If you see any failures in the console, take note of them and edit your environment variables; chances are you didn’t properly set up the entry point or startup script for the project.
When the PyApp binary runs for the first time, it’ll extract itself into a directory that’s usually a subdirectory of the user profile. On future runs, it’ll use that already-unpacked copy and so will launch much faster.
If you want to control where the binary unpacks itself, you can set an environment variable to control where the program writes and looks for its unpacked contents when it’s run:
PYAPP_INSTALL_DIR_ = "path/to/directory"
Note that PYAPP_PROJECT_NAME variable. So, for the program conwaylife, we’d use the variable name PYAPP_INSTALL_DIR_CONWAYLIFE. The directory can be a full path or a relative one, so you could use a directory like ./app to indicate the application should be unpacked into the subdirectory app of the current working directory.
Also note that this setting is not persistent. If you don’t have this exact environment variable set when you run the program, it’ll default to the user-profile directory.
PyApp options
The deployed PyApp executable comes with a couple of convenient commands built into it:
- pyapp self remove: Removes the unpacked app from the directory it was unpacked into.
- pyapp self restore: Removes and reinstalls the app.
Note again that if you used the PYAPP_INSTALL_DIR_ variable to set where the project lives, you must also have it set when running these commands! It’s also important to note that PyApp-packaged apps can generate false positives with antivirus solutions on Microsoft Windows, because the resulting executables aren’t code-signed by default.
.NET 10 Preview 7 adds XAML generator 20 Aug 2025, 12:07 am
The latest preview of Microsoft’s planned .NET 10 application development platform is now available, featuring a source generator for XAML and improved translation for parameterized collections in Entity Framework Core.
This preview was unveiled August 12 and can be downloaded from dotnet.microsoft.com. The production release of .NET 10 is expected in November.
For XAML, .NET MAUI (Multi-platform App UI) now has a source generator for XAML that improves build performance and enables better tools support, Microsoft said. The generator creates strongly typed code for XAML files at compile time, reducing runtime overhead and providing better IntelliSense support. The generator decorates generated types with the [Generated] attribute for better tool integration and debugging support.
With Entity Framework Core 10, the next version of the object-relational mapper, a new default translation mode is introduced for parameterized collections, where each value in the collection is translated into its own scalar parameter. This allows collection values to change without resulting in different SQL code, which results in cache misses and other performance problems, Microsoft said.
Also introduced in .NET 10 Preview 7 is WebSocketStream, an API designed to simplify common WebSocket scenarios in .NET. Traditional WebSocket APIs are low-level and require significant boilerplate for tasks such as handling buffering and framing and managing encoding and decoding, Microsoft said. These complexities make it difficult to use WebSockets as a transport, especially for apps with streaming or text-based protocols. WebSocketStream addresses these issues by providing a Stream-based abstraction over a WebSocket, enabling seamless integration with existing APIs.
Other new features and improvements in .NET 10 Preview 7:
- For Windows,
ProcessStartInfo.CreateNewProcessGroupcan be used to launch a process in a separate process group. JsonSerializer.Deserializenow supportsPipeReader, complementing existingPipeWritersupport.- A new configuration option,
ExceptionHandlerOptions.SuppressDiagnosticsCallback, has been added to the ASP.NET Core exception handler middleware to control diagnostic output. - APIs for passkey authentication in ASP.NET Core Identity have been updated and simplified.
No new features were added for the .NET runtime or for the Visual Basic, C#, and F# languages in Preview 7, Microsoft noted. .NET 10 Preview 7 follows .NET 10 Preview 6, which was released July 15 and featured improved JIT code generation. Preview 5 was released June 10 and featured C# 14 and runtime enhancements. .NET 10 Preview 1 arrived February 25, followed by Preview 2 on March 18, Preview 3 on April 10, and Preview 4 on May 13.
IBM can’t afford an unreliable cloud 19 Aug 2025, 11:00 am
On August 12, 2025, IBM Cloud experienced its fourth major outage since May, resulting in a two-hour service disruption that affected 27 services globally across 10 regions. This “Severity 1” event left enterprise customers locked out of critical resources due to authentication failures, with users unable to access IBM’s cloud console, CLI, or APIs. Such recurring failures reveal systemic weaknesses in IBM’s control plane architecture, the layer responsible for handling user access, orchestration, and monitoring.
This incident followed previous outages on May 20, June 3, and June 4, and further eroded confidence in IBM’s reliability. This does not reflect well on a provider that promotes itself as a leader in hybrid cloud solutions. For industries with strict compliance requirements or businesses that depend on cloud availability for real-time operations, these disruptions raise doubts about IBM’s ability to meet their needs on an ongoing basis. These recurring incidents give enterprises a reason to consider switching to platforms with more reliable track records, such as AWS, Microsoft Azure, or Google Cloud.
For enterprises that have entrusted IBM Cloud with hybrid strategies that balance on-premises systems with public cloud integration, these events strike at the heart of IBM’s value proposition. The hybrid cloud’s supposed benefit is resilience, giving businesses flexibility in handling workloads. A fragile control plane undermines this perceived advantage, leaving IBM’s multi-billion-dollar investments in hybrid systems on shaky ground.
Opening the door for competitors
IBM has traditionally been a niche player in the cloud market, holding a 2% global market share compared to AWS (30%), Microsoft Azure (21%), and Google Cloud (11%). IBM Cloud targets a specific enterprise audience with hybrid cloud integration and enterprise-grade features.
AWS, Azure, and Google Cloud have consistently demonstrated their reliability, operational efficiency, and capacity to scale. Since the control plane is crucial for managing cloud infrastructure, the Big Three hyperscalers have diversified their architectures to avoid single points of failure. Enterprises having issues with IBM Cloud might now consider switching critical data and applications to one of these larger providers that also offer advanced tools for AI, machine learning, and automation.
These outages couldn’t come at a worse time for IBM. With healthcare, finance, manufacturing, and other industries increasingly depending on AI-driven technologies, companies are focused on cloud reliability. AI workloads require real-time data processing, continuity, and reliable scaling to work effectively. For most organizations, disruptions caused by control-plane failures could lead to catastrophic AI system failures.
What IBM can do
IBM must make major changes if it wants to recover its credibility and regain enterprise trust. Here are several critical steps I would take if I were CTO of IBM:
- Adopt a resilient control-plane architecture. Duh. IBM’s reliance on centralized control-plane management has become a liability. A distributed control plane infrastructure will allow individual regions or functions to operate independently and limit the scope of global outages.
- Enhance IAM design with segmentation. Authentication failures have been at the core of the past four outages. Regionally segmented identity and access management (IAM) and distributed identity gateways must replace the globally entangled design currently in place.
- Strengthen SLAs targeting control-plane uptime. Cloud customers demand operational guarantees. By implementing robust service-level agreements (SLAs) focused explicitly on control-layer reliability, IBM could reassure customers that their vital management functions will remain stable even under pressure.
- Increase transparency and communication. IBM needs to be proactive with customers following outages. Offering incident reports, clear timelines for fixes, and planned updates to infrastructure can help rebuild trust, though it will take time. Silence, on the other hand, will only deepen dissatisfaction.
- Accelerate stress-testing procedures. IBM must regularly perform extensive load and resilience testing to identify vulnerabilities before they impact customers. Routine testing in simulated high-pressure operating conditions should be a priority.
- Develop hybrid systems with multi-control-plane options. IBM should adopt multi-control-plane designs to enable enterprises to manage workloads independently of centralized limitations. This would enable hybrid strategies to retain their resilience advantage.
Increasing enterprise resilience
For enterprises wary of any cloud provider’s reliability, there are several steps to build resilience into their operations:
- Adopt a multicloud strategy. By distributing workloads across multiple cloud providers, enterprises reduce dependency on any single vendor. This ensures that even if one provider has a disruption, core business functions remain active.
- Integrate disaster recovery automation. Automated failover systems and data backups across multiple regions and providers can minimize downtime when outages occur.
- Demand stronger SLAs. Enterprises should negotiate contracts that prioritize uptime guarantees for control planes and include penalties for SLA violations.
- Monitor and audit vendor reliability. Enterprises should actively track their cloud providers’ reliability performance metrics and plan for migration if vendors continuously fail to meet standards.
IBM has reached a critical juncture. In today’s competitive market, cloud reliability is the baseline expectation, not a value-added bonus. IBM’s repeated failures—particularly at the control-plane level—fundamentally undermine its positioning as a trusted enterprise cloud partner. For many customers, these outages may serve as the final justification to migrate workloads elsewhere.
To recover, IBM must focus on transforming its control-plane architecture, ensuring transparency, and reaffirming its commitment to reliability through clear, actionable changes. Meanwhile, enterprises should see this as a reminder that resilience must be built into their cloud strategies to safeguard their operations, regardless of provider.
In a world increasingly dependent on AI and automation, reliability isn’t optional—it’s essential. IBM has a lot of work ahead.
Retrieval-augmented generation with Nvidia NeMo Retriever 19 Aug 2025, 11:00 am
Nvidia was founded by three chip designers (including Jensen Huang, who became CEO) in 1993. By 1997 they had brought a successful high-performance 3D graphics processor to market; two years later the company invented the GPU (graphics processing unit), which caused a sea change in computer graphics, specifically for video games. In 2006 they introduced CUDA (Compute Unified Device Architecture), which allowed them to expand their market to scientific research and general-purpose computing. In 2012 they adapted GPUs to neural networks through specialized CUDA libraries (cuDNN) that could be called from Python, which expanded into support for large language models (LLMs).
In 2025, along with other products aimed at developers, Nvidia offers an entire suite of enterprise AI software products, including Nvidia NIM, Nvidia NeMo, and Nvidia RAG Blueprint. Together they can import your raw documents, create a vector-indexed knowledge base, and allow you to converse with an AI that knows and can reason from the contents of the knowledge base. Of course, these programs all take full advantage of Nvidia GPUs.
Nvidia NIM is a set of accelerated inference microservices that allow organizations to run AI models on Nvidia GPUs anywhere. Access to NIM generally requires an Nvidia AI Enterprise suite subscription, which typically costs about $4,500 per GPU per year, but the Essentials level of the suite comes gratis for three to five years with some server-class GPUs such as the H200.
Nvidia NeMo is an end-to-end platform for developing custom generative AI including large language models (LLMs), vision language models (VLMs), retrieval models, video models, and speech AI. NeMo Retriever, part of the NeMo platform, provides models for building data extraction and information retrieval pipelines, which extract structured (think tables) and unstructured (think PDF) data from raw documents.
The Nvidia RAG Blueprint demonstrates how to set up a retrieval-augmented generation (RAG) solution that uses Nvidia NIM and GPU-accelerated components. It provides a quick start for developers to set up a RAG solution using the Nvidia NIM services. The Nvidia AI-Q Research Assistant Blueprint expands on the RAG Blueprint to do deep research and report generation.
Nvidia AI Enterprise
Nvidia AI Enterprise consists of two types of software, application and infrastructure. The application software is for building AI agents, generative AI, and other AI workflows; the infrastructure software includes Nvidia GPU and networking drivers and Kubernetes operators.
Nvidia NIM
Nvidia NIM provides containers to self-host GPU-accelerated inferencing microservices for pre-trained and customized AI models. NIM containers improve AI inferencing for AI foundation models on Nvidia GPUs.
Nvidia NeMo
NeMo tools and microservices help you to customize and apply AI models from the Nvidia API catalog. Nvidia likes to talk about creating data flywheels with NeMo to continuously optimize AI agents with curated AI and human feedback. NeMo also helps to deploy models with guardrails and retrieval-augmented generation.
Nvidia NeMo Retriever
NeMo Retriever microservices accelerate multi-modal document extraction and real-time retrieval with, according to Nvidia, lower RAG costs and higher accuracy. NeMo Retriever supports multilingual and cross-lingual retrieval, and claims to optimize storage, performance, and adaptability for data platforms.
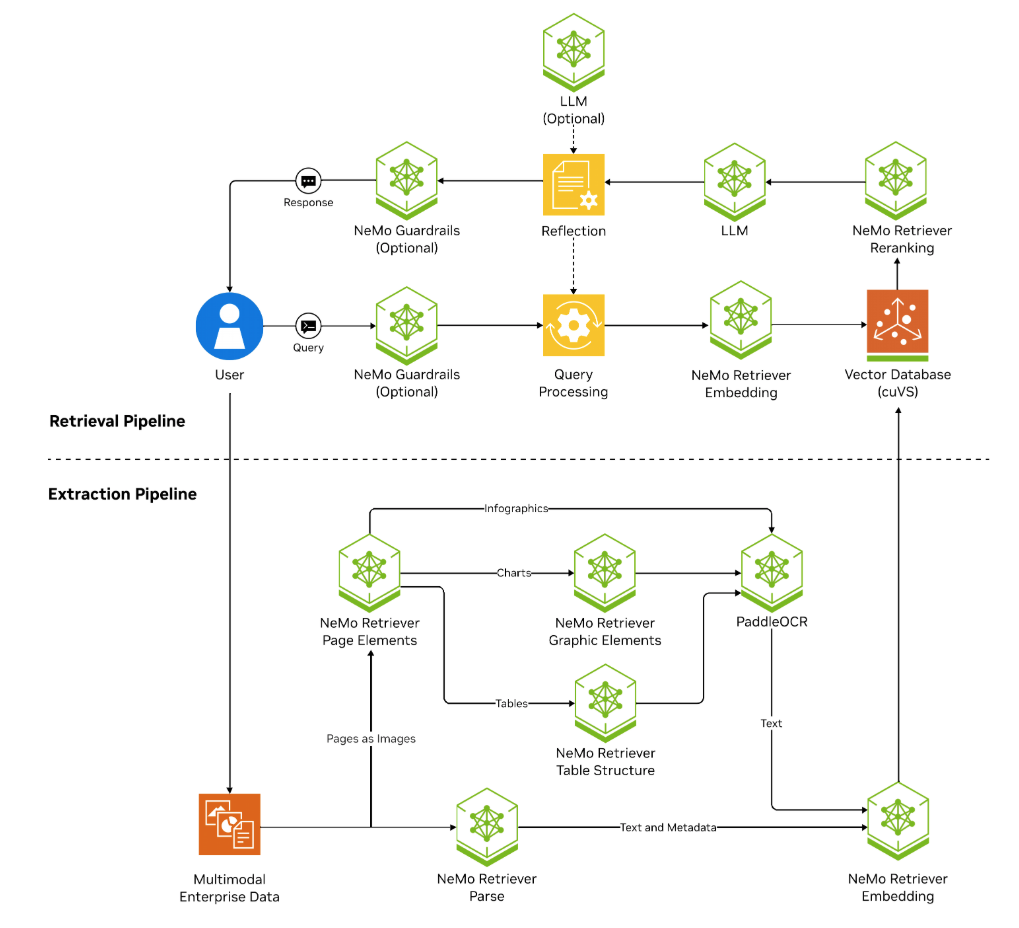
NeMo Retriever architecture diagram. Note how many NeMo components interact with each other to create the retriever flow.
Nvidia
Nvidia AI Blueprints
Nvidia AI Blueprints are reference examples that illustrate how Nvidia NIM can be leveraged to build innovative solutions. There are 18 of them including the RAG Jupyter Notebook we’ll look at momentarily.
Nvidia Brev
Nvidia Brev is a cloud GPU development platform that allows you to run, build, train, and deploy machine learning models on VMs in the cloud. Launchables are an easy way to share software.
Nvidia AI-Q Blueprint RAG and Research Assistant reference examples
Nvidia had me use a Brev launchable running on AWS to test out an AI-Q Blueprint reference example.
The Nvidia RAG blueprint (see figure below) serves as a reference solution for a foundational retrieval-augmented generation pipeline. As you probably know, RAG is a pattern that helps LLMs to incorporate knowledge that wasn’t included in their training and to focus on relevant facts; here it is designed to allow users to query an enterprise corpus.
The Nvidia RAG blueprint is a bit more complicated than you might expect, at least partially because it’s trying to handle a variety of input formats, including text, voice, graphics, and formatted pages (e.g. PDFs). It includes refinements such as re-ranking, which narrows relevancy lists; OCR, which extracts text from graphics; and guardrails, which protect against incoming query-based jailbreaks as well as against certain kinds of outgoing hallucinations.
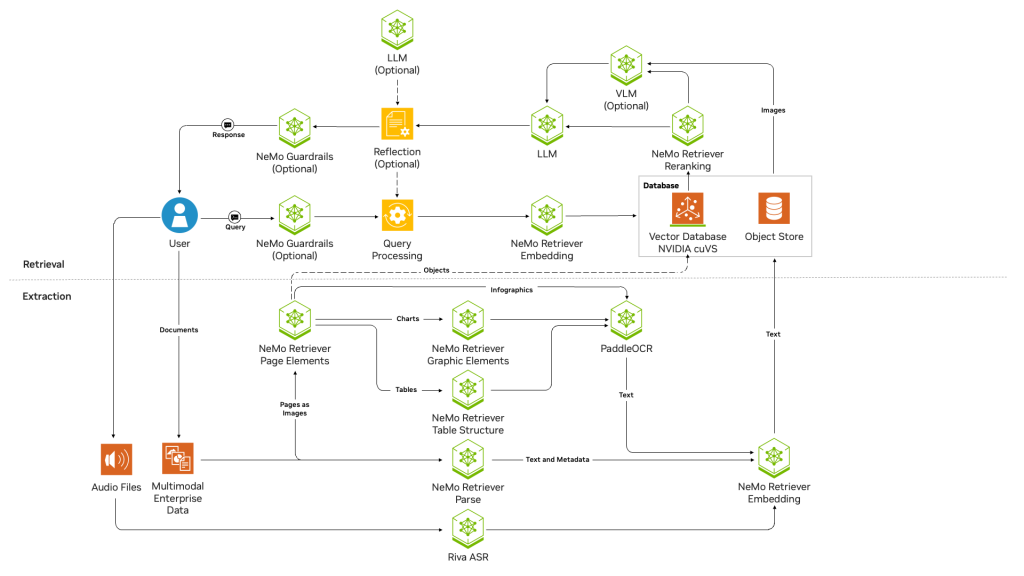
Nvidia RAG blueprint architecture diagram. Note that this flow includes NeMo Retriever components, LLMs, an OCR component, an object store, and a vector database. The query processing block is based on the LangChain framework.
Nvidia
The Nvidia AI-Q Research Assistant blueprint (see figure below) depends on the RAG blueprint and on an LLM-as-a-judge to verify the relevance of the results. Note the reasoning cycle that occurs prior to final report generation.
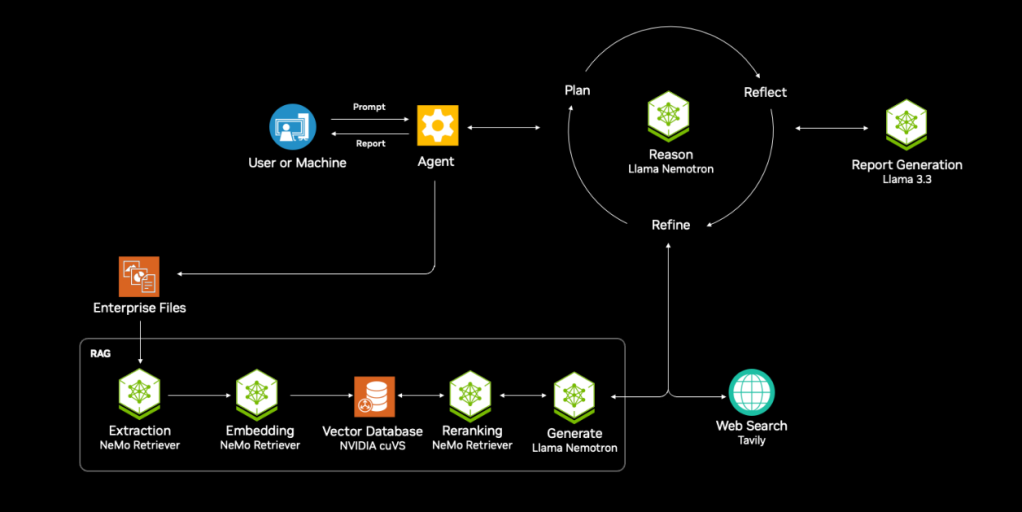
In addition to RAG functionality, the AI-Q Research Assistant creates a report plan, searches data sources for answers, writes a report, reflects on gaps in the report for further queries, and finishes a report with a list of sources. Note that Llama models are used to generate RAG results, to reason on the results, and to generate the report.
Nvidia
The screenshots below are from my runs of the AI-Q Research Assistant blueprint.
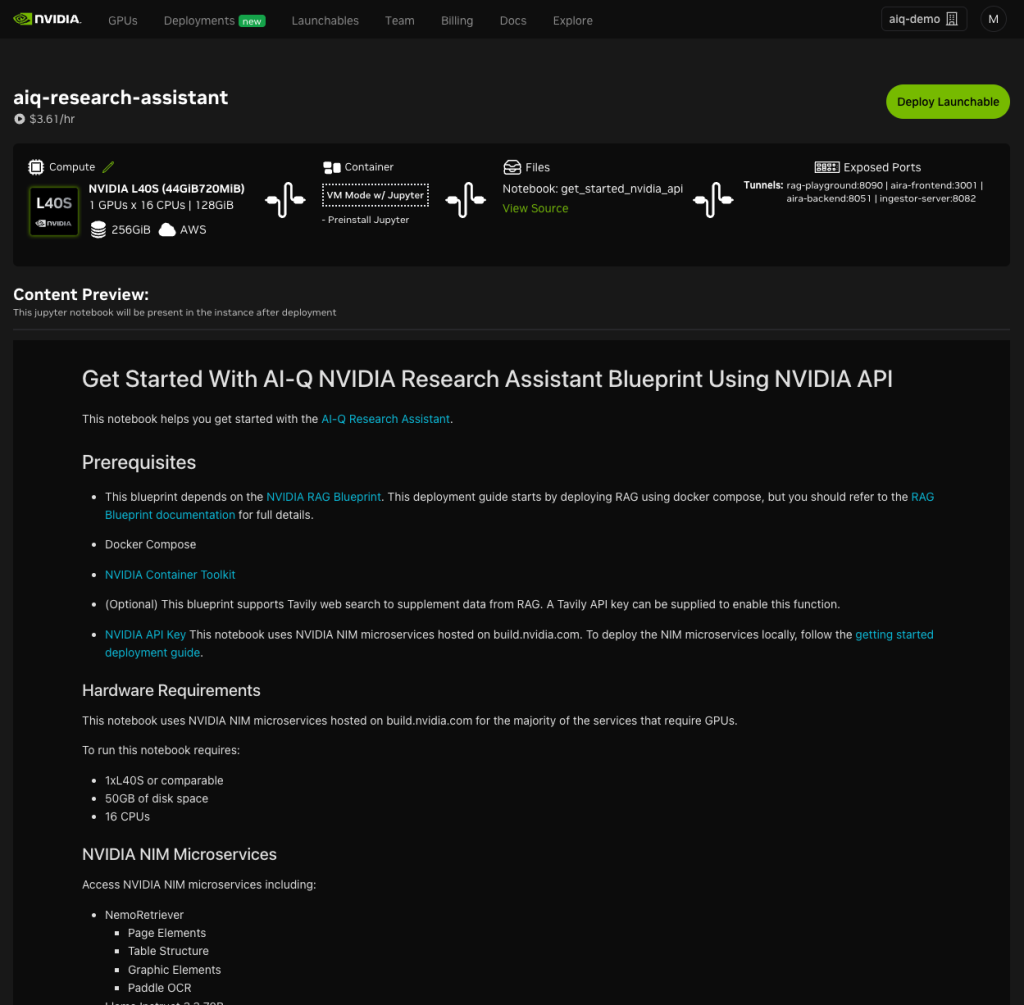
Nvidia AI-Q Research Assistant blueprint starter page. The bar at the top shows the overall system diagram, and the text below shows a preview of the Jupyter Notebook which appears in the instance. Note that the AI-Q Research Assistant depends on the Nvidia RAG blueprint, shown a few diagrams up from here.
Foundry

Starting the AI-Q Research Assistant.
Foundry
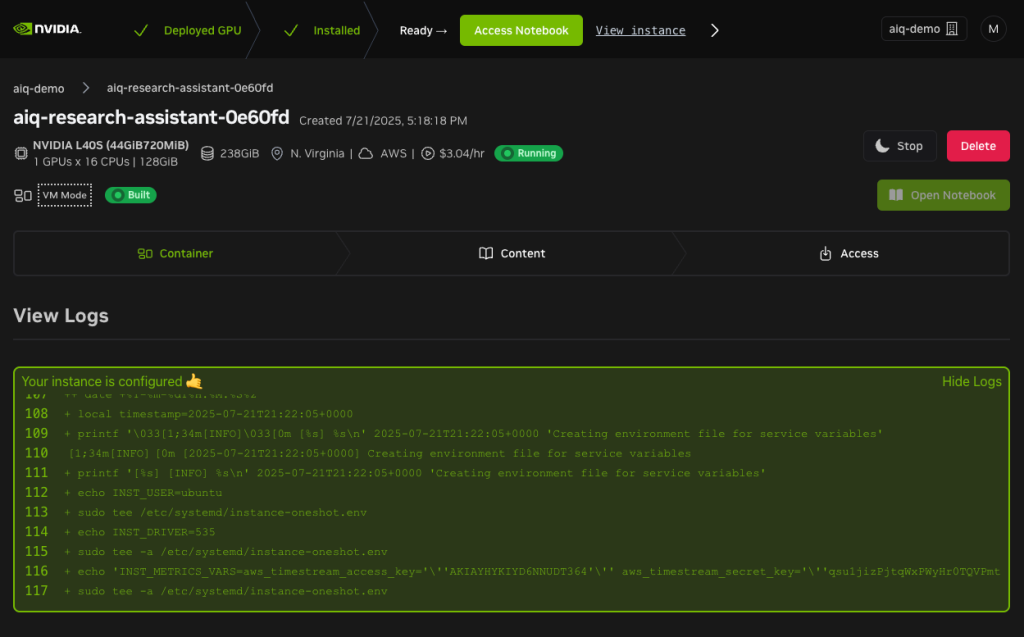
Running AI-Q Research Assistant instance. The preview of the Jupyter Notebook has been replaced by the instance logs.
Foundry

The Jupyter Notebook that appears when the AI-Q Research Assistant is running. The third item down in the directory is what we want.
Foundry
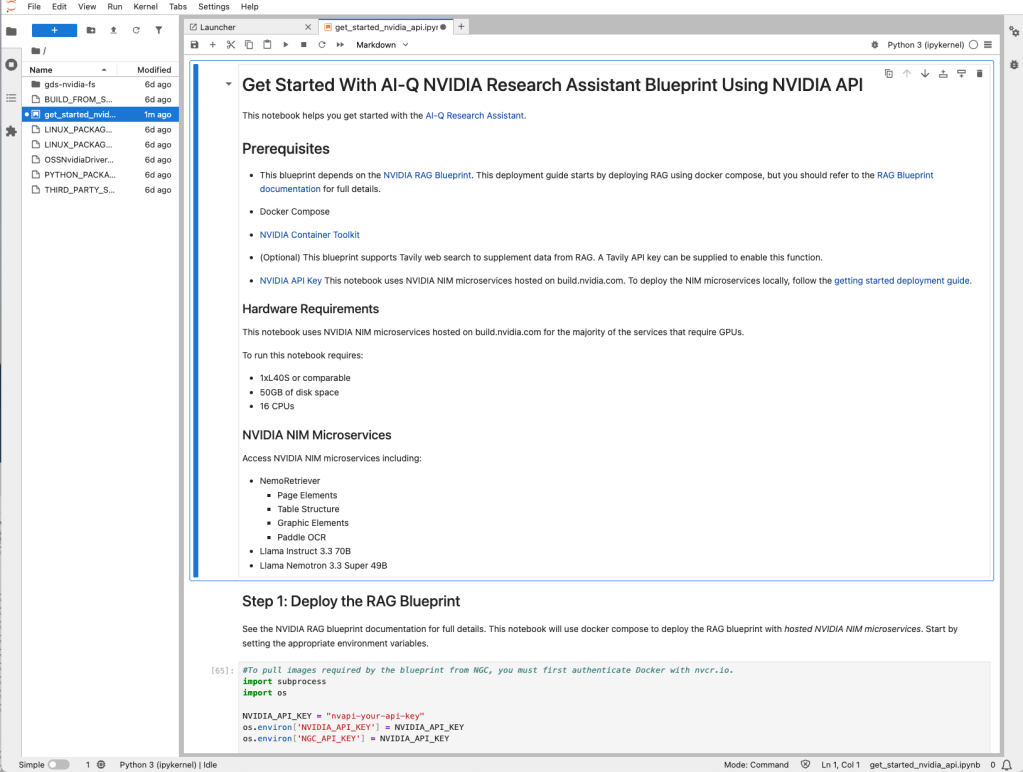
The beginning of the “Get Started” Jupyter Notebook for the AI-Q Research Assistant blueprint. The first cell should look familiar from the preview of the launchable.
Foundry

Report plan for Amazon 2023 financial performance. You can ask for changes to the plan at this point if you wish.
Foundry

Amazon 2023 financial report generated by the AI-Q Research Assistant. You can dive into its process or ask for changes if you wish.
Foundry
AI-powered research with RAG
The Nvidia AI-Q Research Assistant blueprint I tested did a better job than I expected at ingesting financial reports in PDF form and generating reports based on them in response to user queries. One of the surprises was how well the Llama-based models performed. In separate tests of Llama models in naive RAG designs my results were not nearly as good, so I have to conclude that the plan-reflect-refine architecture helped a lot.
I would have expected my tests of this system to take a day or less. In fact, they took me about a week and half. My first problem turned out to be an error in the documentation. My second problem turned out to be a failure in a back-end process. I was assured that Nvidia has fixed both issues, so that you’re not likely to encounter them.
Bottom line
The Nvidia AI-Q Research Assistant blueprint I tested did a better job than I expected at ingesting financial reports in PDF form and generating reports based on them in response to user queries. In separate tests of Llama models in naive RAG designs, my results were not nearly as good. Chalk one up for the plan-reflect-refine architecture.
Pros
- Able to create a credible deep research assistant that can run on-prem or in the cloud
- Models iterate on the report to refine it
- NeMo Retriever makes quick work of PDF ingestion
- Open source blueprint can be adapted to your own AI research applications
Cons
- The version tested still had a few bugs, which should now be fixed
- Very much tied to Nvidia GPUs
Cost
Contact your authorized Nvidia partner for pricing.
Platform
Docker Compose or Nvidia AI Workbench, server-class Nvidia GPU(s) with sufficient memory. Can be run on a cloud with Nvidia APIs, or on premises in containers.
The successes and challenges of AI agents 19 Aug 2025, 11:00 am
AI has changed a lot in just two years. In 2023, most companies were experimenting with large language models. These tools helped with writing, research, and support tasks. They were smart, but they waited for instructions and could not take action on their own.
In 2025, we are seeing something more powerful: AI agents. They are not just chat tools anymore. They can remember, plan, use tools, and act on their own. AI agents can take a broad goal, figure out the steps, and carry it out without needing help at every stage. Some can even fix problems along the way.
Early wins
These agents have moved beyond research and begun working inside real businesses. For example, ServiceNow uses AI agents to manage IT requests. If someone needs software installed or a license updated, the agent takes care of it from start to finish. There are no tickets to raise and no waiting time.
GitHub Copilot is another example. It now has a mode where the agent understands what the developer is trying to do, choosing tools, making decisions, and completing small coding tasks on its own. For developers, this saves time and removes repetitive work.
A final example is Cisco, which is using AI agents inside Webex to improve customer service. One agent speaks directly to customers, another supports human agents during live calls, and a third listens and creates a summary of the conversation with tone and sentiment analysis. These layers work together and make customer support faster and more accurate.
These applications of AI agents work well because the tasks are clear and follow a standard process. But agents are now being trained to handle more complex problems too.
Take this use case: A business analyst is trying to answer why sales dropped for a product last quarter. In the past, a human would explore the data, come up with possible reasons, test them, and suggest a plan. Now, an AI co-pilot is being trained to do most of that work. It pulls structured data, breaks it into groups, tests different ideas, and surfaces the insights. This kind of system is still in testing but shows what agents might be able to do soon.
A better approach
Even with these early wins, most companies are still trying to add agents to old workflows, which limits their impact. To really get the benefits, businesses will need to redesign the way work is done. The agent should be placed at the center of the task, with people stepping in only when human judgment is required.
There is also the issue of trust. If the agent is only giving suggestions, a person can check the results. But when the agent acts directly, the risks are higher. This is where safety rules, testing systems, and clear records become important. Right now, these systems are still being built.
One unexpected problem is that agents often think they are done when they are not. Humans know when a task is finished. Agents sometimes miss that. In some tests, over 30% of multi-agent failures were caused because one agent thought the task was completed too early.
To build agents, developers are using tools like LangChain and CrewAI to help create logic and structure. But when it comes to deploying and running these agents, companies rely on cloud platforms. In the future, platforms like AWS and Google Cloud may offer complete solutions to build, launch, and monitor agents more easily.
Today, the real barrier goes beyond just technology. It is also how people think about agents. Some overestimate what they can do; others are hesitant to try them. The truth lies in the middle. Agents are strong with goal-based and repeatable tasks. They are not ready to replace deep human thinking yet.
The value of agents
Still, the direction is clear. In the next two years, agents will become normal in customer support and software development. Writing code, checking it, and merging it will become faster. Agents will handle more of these steps with less need for back-and-forth. As this grows, companies may create new roles to manage agents, needing someone to track how they are used, make sure they follow rules, and measure how much value they bring. This role could be as common as a data officer in the future.
The hype over AI agents is loud, but the real change is quiet. Agents are not taking over the world; they are just taking over tasks. And in doing that, they are changing how work feels—slowly but surely.
Aravind Chandramouli is vice president, AI Center of Excellence, at Tredence.
—
Generative AI Insights provides a venue for technology leaders to explore and discuss the challenges and opportunities of generative artificial intelligence. The selection is wide-ranging, from technology deep dives to case studies to expert opinion, but also subjective, based on our judgment of which topics and treatments will best serve InfoWorld’s technically sophisticated audience. InfoWorld does not accept marketing collateral for publication and reserves the right to edit all contributed content. Contact doug_dineley@foundryco.com.
Go language previews performance-boosting garbage collector 19 Aug 2025, 1:54 am
Go 1.25, the latest version of the Google-developed open source programming language, has been released. The update brings new capabilities including an experimental garbage collector that improves performance, a fix for a compiler bug that could delay pointer checks, and a package that provides support for testing concurrent code.
Announced August 12 by the Go team, Go 1.25 can be accessed at go.dev. The release includes enhancements across tools, the runtime, the standard library, the compiler, and the linker.
The new garbage collector has a design that improves performance of marking and scanning small objects through better locality and CPU scalability, according to the Go team. The team expects a 10% to 40% reduction in garbage collection overhead in real-world programs that heavily use the collector. Developers can enable the collector by setting GOEXPERIMENT=greenteaqc at build time.
For the compiler, meanwhile, the release fixes a bug from Go 1.21 that could incorrectly delay nil pointer checks. Programs like the one below, which used to execute successfully when they shouldn’t, the Go team said, will now correctly panic with a nil-pointer exception.
package main

import "os"

func main() {
    f, err := os.Open("nonExistentFile")
    name := f.Name()
    if err != nil {
        return
    }
    println(name)
}
In the standard library, Go 1.25 has a new testing/synctest package that supports testing for concurrent code. The Test function runs a test function in an isolated “bubble,” the team said. Within the bubble, time is virtualized: time package functions operate on a fake clock and the clock moves forward instantaneously if all goroutines in the bubble are blocked. Also, the Wait function waits for all goroutines in the current bubble to block. This package first became available in Go 1.24 under GOEXPERIMENT=synctest, with a slightly different API. The experiment has graduated to general availability.
Go 1.25 follows Go 1.24, which was introduced in February with enhancements pertaining to generic type aliases and WebAssembly. The Go language has gained attention lately with Microsoft’s plan to port the TypeScript compiler and tools to the language, with the intent of boosting performance.
Also featured in Go 1.25:
- An experimental JSON implementation, when enabled, provides an encoding/json/v2 package, which is a major revision of the encoding/json package, and the encoding/json/jsontext package, which provides lower-level processing of JSON syntax.
- The
go build -asanoption now defaults to doing leak detection at program exit. This will report an error if memory allocated by C is not freed and is not referenced by any other memory allocated by either Go or C. - The compiler now can allocate the backing store for slices on the stack in more situations, improving performance.
- The compiler and linker now generate debug information using DWARF (debugging with attributed record formats) Version 5.
- The Go distribution will include fewer prebuilt tool binaries. Core toolchain binaries such as the linker and compiler still will be included, but tools not invoked by build or test operations will be built and run by
go toolas needed. - The linker now accepts a
-funcalign=Ncommand line option that specifies the alignment of function entries. The default value is platform-dependent and unchanged in Go 1.25. - For cryptography,
MessageSigneris a signing interface that can be implemented by signers that wish to hash the message to be signed themselves.
Google adds VM monitoring to Database Center amid enterprise demand 18 Aug 2025, 1:55 pm
Google has updated its AI-powered database fleet management offering — Database Center — with the capability to monitor self-managed databases running on its own compute virtual machines (VMs).
Several enterprises run their databases, such as PostgreSQL and MySQL, on compute VMs as they offer more flexibility, scalability, and cost-effectiveness when compared to dedicated hardware.
Earlier, enterprises could use the Database Center to only monitor Google-managed databases, including Spanner, AlloyDB, and Bigtable.
This capability, according to Google, is a result of several enterprises demanding support for monitoring self-managed databases to gain full oversight of all their deployed databases.
“This holistic visibility helps identify critical security vulnerabilities, improve security posture, and simplify compliance,” said Charlie Dai, VP and principal analyst at Forrester.
These security vulnerabilities could include outdated minor versions, broad IP access range, having databases without a root password, and having databases that don’t have auditing enabled, Google executives wrote in a blog post.
This capability is currently in preview, and enterprises need to sign up for early access to get access to it.
Google has also added new capabilities to the Database Center, such as alerting for new resources and issues for all the databases, adding Gemini-powered natural language capabilities for folder-level fleet management, and historical fleet comparison up to 30 days.
Google said its alerting for new resources and issues for all databases will allow enterprise users to create custom alerts when new database resources are provisioned and also receive alerts via email, Slack, and Google chat messages for any new issue types detected by Database Center.
This capability will enable proactive monitoring and allow immediate action to enforce governance policies, prevent configuration drift, and mitigate risks before they impact applications, Dai said.
In order to simplify fleet monitoring at scale, Google has added Gemini-powered language capabilities to Database Center at the folder level.
“This means you can now have contextual conversations about your databases within a specific folder, making it easier to manage and troubleshoot databases, especially in large and complex organizational environments,” Google executives wrote in a blog post.
The historical fleet comparison feature for 30 days, on the other hand, can be used by enterprises in capacity planning and the analysis of database fleet health.
Earlier, Google offered a seven-day historical comparison for database inventory and issues, and now it offers three options: 1 day, 7 days, and 30 days.
Enterprises or database administrators can use the fleet comparison feature to get a detailed view of new database inventory and identify new operational, security issues that emerged during the selected period, Google executives wrote.
This should help database administrators in enterprises use data-driven decisions for fleet optimization, Dai said.
Google did not clarify whether the additional capabilities are already available for enterprise users.
More Google news and insights:
Why AI fails at business context, and what to do about it 18 Aug 2025, 11:00 am
Here’s the awkward truth about today’s “smart” AI: It’s great at syntax, mediocre at semantics, and really bad at business context. That last bit matters because most enterprise value hides in the seams—how your organization defines active customer, which discount codes apply on Tuesdays, which SKU names were changed after the acquisition, and why revenue means something different to the finance department than the sales team.
Models can ace academic tests and even crank out reasonable SQL. Drop them behind the firewall inside a real company, however, and they stumble. Badly.
Tom Tunguz highlights a sharp example: The Spider 2.0 benchmarks test how well models translate natural language into SQL across realistic enterprise databases. These models peak around 59% exact-match accuracy and fall to roughly 40% when they add transformation/code-generation complexity. These aren’t toy data sets; they reflect messy, sprawling schemas that look like what real enterprises run in production. In other words, the closer we get to real business context, the more the artificial intelligence struggles.
If you build enterprise software, this shouldn’t surprise you. As I’ve noted, developers’ primary issue with AI isn’t whether it can spit out code—it’s whether they can trust it, consistently, on their data and their rules. That’s the “almost-right” tax: You spend time debugging and fact-checking what the model produced because it doesn’t quite understand your specifics.
Why business context is hard for AI
Large models are mostly pattern engines trained on public text. Your business logic—how you calculate churn, the way your sales territories work, the subtle differences between two nearly identical product lines—isn’t on the public web. That information lives in Jira tickets, PowerPoints, institutional knowledge, and databases whose schemas are artifacts of past decisions (and the key to enterprise AI’s memory). Even the data model fights you: tables with a thousand columns, renamed fields, leaky dimensions, and terminology that drifts with each reorg.
Spider 2.0 measures that reality, which is why scores drop as tasks get closer to actual workflows, such as multi-step queries, joins across unfamiliar schemas, dialect differences, transformations in DBT, etc. Meanwhile, the enterprise is moving toward agentic models that can browse, run code, or query databases, which only magnifies the risk when the model’s understanding is off.
Put differently: Business context isn’t just data; it’s policy plus process plus history. AI gets the shape of the problem but not the lived reality.
Can we fix this?
The good news is we don’t need a philosophical breakthrough in understanding. We just need better engineering around the memory, grounding, governance, and feedback of the model. I’ve made the case that AI doesn’t need more parameters as much as it needs more memory: structured ways to keep track of what happened before and to retrieve the domain data and definitions that matter. Do that well and you narrow the trust gap.
Is the problem fully solvable? In bounded domains, yes. You can make an AI assistant that’s reliable on your finance metrics, your customer tables, your DBT models, and your security policies. But business context is a moving target, and humans will keep changing the rules. That means you’ll always want humans (including developers, of course) in the loop to clarify intent, adjudicate edge cases, and evolve the system to keep up with the business. The goal isn’t to eliminate people; it’s to turn them into context engineers who teach systems how the business actually works. Here’s how to get there.
First, if you want reliable answers about your business, the model has to see your business. That starts with retrieval-augmented generation (RAG) that feeds the model the right slices of data and metadata—DDL, schema diagrams, DBT models, even a few representative row samples—before it answers. For text-to-SQL specifically, include table/column descriptions, lineage notes, and known join keys. Retrieval should include governed sources (catalogs, metric stores, lineage graphs), not just a vector soup of PDFs. Spider 2.0’s results make a simple point that when models face unfamiliar schemas, they guess. So, we need to reduce unfamiliarity for the models.
Second, most AI apps are amnesiacs. They start fresh each request, unaware of what came before. You thus need to add layered memory (working, long-term, and episodic memory). The heart of this memory is the database. Databases, especially ones that can store embeddings, metadata, and event logs, are becoming critical to AI’s “mind.” Memory elevates the model from pattern-matching to context-carrying.
Third, free-form text invites ambiguity; structured interfaces reduce it. For text-to-SQL, consider emitting an abstract syntax tree (AST) or a restricted SQL dialect that your execution layer validates and expands. Snap queries to known dimensions/measures in your semantic layer. Use function/tool calling—not just prose—so the model asks for get_metric('active_users', date_range='Q2') rather than guessing table names. The more you treat the model like a planner using reliable building blocks, the less it hallucinates.
Fourth, humans shouldn’t spend all day correcting commas in SQL. Build an approval flow that focuses attention where ambiguity is highest. For example, highlight risky joins, show previews with row-level diffs against known-good queries, and capture structured feedback (“status_code in (3,5) should be excluded from active customers”) and push it back into memory and retrieval. Over time, your system becomes a better context learner because your experts are training it implicitly as they do their jobs.
Fifth, measure what matters. Benchmarks are useful, but your KPI should be “helped the finance team close the quarter accurately,” not “passed Spider 2.0 at 70%.” Hence, you need to build task-specific assessments. Can the system produce the three canonical revenue queries? Does it respect access controls 100% of the time? Run these evaluations nightly. Spider 2.0 also shows that the more realistic the workflow (think Spider2-V’s multi-step, GUI-spanning tasks), the more room there is to fail. Your evaluations should match that realism.
People and machines
All this should make it clear that however sophisticated AI may get, we’re still going to need people to make it work well. That’s a feature, not a bug.
The business context problem is engineering-solvable within a scope. With the right grounding, memory, constraints, evaluations, and security, you can build systems that answer enterprise questions reliably most of the time. You’ll shrink the “almost-right” tax significantly. But context is social. It’s negotiated in quarterly business reviews and hallway conversations. New products launch, legal policies change, someone tweaks a definition, a merger redraws everything. That continual renegotiation guarantees you’ll want human judgment in the loop.
The role of developers shifts accordingly. They go from code generators to context engineers, curators of semantic layers, authors of policy as code, designers of retrieval and memory, and stewards of the feedback loops that keep AI aligned with reality. That’s also why developers remain indispensable even as AI gets better. The more we automate, the more valuable it is to have someone who understands both the machine and the business.
If you’re trying to make AI useful in your company, aim for a system that remembers, retrieves, and respects:
- Remembers what happened and what’s been decided (layered memory)
- Retrieves the right internal truth at the right moment (governed grounding)
- Respects your policies, people, and processes (authorization that travels with the task)
Do that and your AI will feel less like a clever autocomplete and more like a colleague who actually gets it. Not because the model magically developed common sense, but because you engineered the surrounding system to supply it.
That’s the real story behind Spider 2.0’s sobering scores, which are not an indictment of AI but a blueprint for where to invest. If your model isn’t delivering on business context, the fix isn’t a different model so much as a different architecture—one that pairs the best of human intelligence with the best of artificial intelligence. In my experience, that partnership is not just inevitable. It’s the point.
Why software developers burn out, and how to fix it 18 Aug 2025, 11:00 am
Software development is a demanding field where changes happen rapidly. Developers are pushed to constantly learn and innovate while simultaneously producing a high volume of code. It’s no surprise that software engineers and other development professionals experience burnout. The question is how to manage burnout once it’s happened, or even better, how to prevent it in the first place.
Tim Lehnen, CTO of the Drupal Association, which manages the Drupal open source project, notes that burnout is a long-standing challenge in the developer community. “We have not yet overcome burnout as a challenge,” he says. “I’m in a unique position as part of an open source foundation to interact with developers both in the context of their careers and as open source contributors, and in both contexts, I see burnout as a highly prevalent issue.”
LeadDev, a provider of events and content for the developer community, surveyed 617 engineering leaders for its Engineering Leadership worldwide survey in March 2025. The survey found that 22 percent of developer respondents were facing critical levels of burnout.
Nearly one quarter of the respondents reported being moderately burned out; one third said they were experiencing relatively low levels of burnout; and 21 percent were categorized as “healthy” according to LeadDev. Software engineers who fall into the healthy category are more likely to receive encouragement at work, according to the LeadDev report, with 39 percent of respondents reporting they receive positive feedback at least once a week.
Why do software developers burn out?
“Developer burnout is real and it’s systemic, not a personal failing,” says Patrice Williams-Lindo, CEO of Career Nomad, a provider of career coaching services, and a senior management consulting executive. She sees three major causes of burnout.
One is the constant interruptions or “chaos” developers face in their work. “Developers are asked to jump between projects, tools, and meetings, with minimal protection of deep work time,” Williams-Lindo says.
Another is the undefined completion of projects, leading to perpetual overwork. “Vague requirements and shifting business goals leave developers feeling like the work is never complete, fueling exhaustion,” Williams-Lindo says.
And third is the lack of human-centered adoption of tools and processes, which drains cognitive energy. “New tools and processes get layered on without training or input, creating hidden friction that drains cognitive energy,” she says.
How AI contributes to developer burnout
The increased use of artificial intelligence in the workplace is another factor. “With the improvements in AI, I think developers more than ever are under pressure to work faster and provide cheaper, faster, and better solutions than in the past,” says David Wurst, founder of digital marketing company WebCitz LLC.
“We work with clients and other development agencies, almost all of which have reduced workforce in the past year due to being able to do more with AI,” Wurst says. “In reality, this puts more pressure on remaining staff to handle the additional work, solve issues that don’t easily get resolved by AI, and go back and forth more between teams.”
The rate of change introduced by AI “is creating even more pressure on developers,” says Mehran Farimani, CEO at cybersecurity software company RapidFort. “The pace at which new AI tools and frameworks appear is dizzying, and developers feel compelled to keep up just to stay relevant.”
Continuous learning is energizing, Farimani says, but the expectation to adopt every new advancement immediately can lead to cognitive overload. “Without deliberate prioritization, ‘AI FOMO [fear of missing out]’ can quickly morph into sustained stress,” he says.
Job security from AI-induced redundancies can also contribute to developer worries. “There have been mass layoffs at major tech companies, and this could be the start of a source of stress for developers generally,” Farimani says. “Even for high-performing engineers, headlines about automation and widespread tech layoffs raise uncomfortable questions about career stability.”
Worrying about being replaced or restructured adds a background hum of anxiety that feeds burnout, even if the work itself remains engaging, Farimani says.
Developer burnout and induced stress within high-performing development teams are not new, notes Conal Gallagher, CIO at Flexera, a provider of IT management software.
“Under-resourced and over-utilized teams have been grappling with digital transformation and security challenges for years,” Gallagher says. “While the promise of AI efficiencies and productivity gains is alluring, the reality is that harried teams are being pressured to adopt AI in a way that is exacerbating the situation.”
Teams are expected to jump between solutions and deliver on AI transformation without allocated funding, Gallagher says. “At the same time, [teams] are asked to be mindful of security risks that these solutions potentially introduce, all while delivering on the promise of AI,” he says.
Why remote work is a double-edged sword
Another factor that has contributed to burnout is the rise of remote work. With the ability to work from home, developers can easily work longer hours or forget to take breaks.
“Working from home removes the physical boundary of ‘leaving the office,’ making it easier, almost inevitable, to log back in after hours,” Farimani says. “While the added flexibility can be great, the blurred line between personal and professional time can quietly stretch the workday far beyond eight hours,” he says. “Over time, that creep can translate into chronic overwork.”
How to prevent software developer burnout
Tech leaders and organizations can take steps to address the problem of developer burnout.
“An organization doesn’t have much power to affect the externalities causing burnout, especially political or economic factors, but this just means that controlling the internal factors is even more important,” Lehnen says, noting there are a few key strategies to follow.
“Double down on capacity-driven, agile project management. If your business priorities are being driven by drop-dead deadlines, you are not building in any capacity to pivot to respond to these externalities, and so the only solution you have left is a spiral of crunch-time, missed deadlines, and an overcommitted team that can’t respond to the next opportunity.”
To avoid burning out their development team, tech leaders should focus on planning processes based on business impact, using a combination of capacity planning and triage, Lehnen says. “Ensure that your project plans include time to measure results, or else you’ll risk projects staying endlessly at 85 percent completion,” he says.
Increase developer autonomy
Lack of control is a major contributing factor to developer burnout, says Lehnen. “Instead of a landscape of priorities, they begin to feel that everything is of equal—emergency-level—importance.” Rather than a steady cadence of continuous delivery, “the workstream becomes a just-in-time process of putting out fires,” he says.
Companies can insulate developers by ensuring that the prioritization process is transparent and that developers are part of estimating timelines. They can also create a process for nominating projects to be re-prioritized when roadmaps change. These and other steps can increase a developer’s sense of personal autonomy, Lehnen says, “which is the antidote to burnout.”
Other ways to enhance a developer’s sense of autonomy include work-from-home policies and more control of meeting schedules.
Involve developers in decisions that affect them
Another way to prevent burnout is to involve developers in the hiring process, which helps to ensure the people being brought onto a team will complement the existing workforce, Wurst says.
Organizations also should take a more collaborative approach to implementing AI, Wurst says. “Ask what tools can help and what training might be needed,” he says. “Talk through with developers the shortfalls of using AI to get a better understanding of what can be expected of a developer for resource requirements.”
AI can drastically increase development speed, but it can also take developers down odd paths that waste their time, Wurst says. AI isn’t beneficial in every situation, he says. Discussing the pros and cons of AI integration “will help improve communication and reduce stress for what the developer feels is on their shoulders,” he says.
Open communication from leadership about upskilling paths for organizations integrating AI tools can go a long way toward easing fears about job security, Farimani says.
Protect ‘deep work’ time
Another good practice is to protect deep work blocks of time by aligning business and functional priorities. “Define what success looks like for each sprint, and protect three- to four-hour deep work blocks for developers by aligning business and functional stakeholders on realistic timelines,” Williams-Lindo says.
For example, she says, one Career Nomad client restructured standup meetings and stakeholder updates to reduce unnecessary daily context switching—the mental shift needed when switching between different tasks or projects. This immediately improved team energy and the pace of delivery.
“When rolling out new tools [such as AI copilots], pair them with training, clear use cases, and a feedback loop so developers don’t feel like they’re constantly being thrown into ‘figure it out alone’ mode,” Williams-Lindo says. “Tech upgrades should simplify, not complicate, workflows,” she says.
Development leaders can also shift from “lines of code” or “tickets closed” to metrics such as system stability, customer outcomes, and team health indicators. “This not only reduces pressure, but also anchors teams in purpose, reducing the cynicism that fuels burnout,” Williams-Lindo says.
How does the metrics layer enhance the power of advanced analytics? 18 Aug 2025, 11:00 am
Amid all the buzz around advanced AI-powered data analytics, one crucial component often goes unnoticed: the metrics layer. This is where metrics creation takes place, the process that defines and manages the metrics that turn data signals into actionable, meaningful insights.
Although it’s increasingly vital for effective analytics, metric creation often does not receive enough attention in the broader business intelligence (BI) package, and enterprises frequently fail to understand its role.
What is the metrics layer?
Metrics turn a concept into something that can be measured. They provide the framework upon which stakeholders can track changes in whatever they want to track. Until raw data signals are converted into metrics, there’s no way to measure improvements or degradation, and no way to identify patterns or trends.
The metrics layer, metrics creation, metrics store, metrics platform or headless BI are all different terms for creating, managing, defining, enforcing and delivering metrics. The bundle of best practices, features and tools resides between the data source and the apps that use the data and deliver insights — hence the term “metrics layer.”
A metrics layer:
- Serves as a single source of truth for metrics across all your dashboards, reports, applications and more.
- Holds information about how to calculate metrics and the attributes that should be used to evaluate KPIs, like data repositories do for data and GitHub does for code.
- Translates requests for metrics into SQL queries, executes the requests and then returns the metrics to the users.
- Defines key metrics, explains what the data represents, such as whether an increase is favorable or negative, and shows how metrics relate to each other.
According to Gartner, which was one of the first entities to use the phrase, metrics creation is a use case that “Enables organizations to connect to data, prepare data and define standardized metrics that can be shared throughout the organization.”
“A metrics layer allows an organization to standardize its metrics and how they are calculated. It builds a single source of truth for all metric or KPI definitions for all data sources in the organization,” explains Christina Obry, a product manager at Tableau.
Is a metrics layer essential for BI success?
Metrics creation is so critical that Gartner considers it a mandatory component for any BI platform. Without a strong metrics layer, BI platforms struggle to deliver useful business intelligence.
There’s simply too much data flooding into enterprises, but also, there are too many tools measuring and analyzing that data, resulting in inconsistent metrics. Even simple metrics can become muddled, with tools disagreeing about how to measure them.
Avi Perez, CTO and co-founder of Pyramid Analytics, says that “Mature organizations understand the need for a protocol that ensures formulas are calculated consistently, maximizing their usefulness to users across departments. They don’t promote self-service at the expense of a single source of truth, and they seek out mechanisms for standardizing metrics.”
Data only has value when it’s transmuted into insights, but those insights need to reach the right decision-makers together with the right context. A metrics layer enables the creation of a universal glossary of metrics that every business stakeholder can utilise to inform sound decisions.
The dangers of operating without a metrics layer
Imagine counting the number of active users for an app. Should they be measured weekly, monthly or annually? How long can users go between logins before they are no longer considered “active” users? What’s the best way to segment them geographically?
The gaps in how these questions are answered lead to wasted time, a loss of trust in the data and widespread confusion. Without a universally managed metrics layer, departments can become misaligned and measure the same metric differently. In an era of data-driven business decision-making, muddled or inconsistent data can lead to damagingly erroneous decisions.
Fixing these inconsistencies can be a nightmare. First, you have to find them all, scattered across all your data sources, analysis tools and custom queries. As they are reused without oversight, the inconsistencies grow. Changing the business logic definition for every tool, every department leader, every time, means that data teams waste time firefighting instead of working on tasks that deliver value.
“Your organization has multiple dashboards. It may have multiple BI tools, too. Do you really want to define the business logic for your metrics every single time in each of those outlets? What if the logic changes as the business grows? That increases the chances of one instance being slightly off or out of date by the time someone looks at it and makes a decision,” warns Chris Nguyen, a BI analyst at Keller Williams Realty International.
A centralized metrics layer is a way to define and store metrics in a single place, so that everyone in your organization uses the same logic, every time.
What are the benefits of a metrics layer?
Metrics creation delivers value that goes beyond the critical need for consistent metrics. By setting up a centralized repository for business metrics and KPIs, organizations enjoy numerous benefits:
- More trust in data, thanks to consistency in the metrics used across the organization
- Improved accessibility to vital metrics for line-of-business users who aren’t data experts
- Increased scalability for business logic across the company
- Shorter time to insights and real-time updates
- Greater adaptability to changing business needs
IT consultant Sean Michael Kerner emphasizes that “metrics stores provide a consistent way for organizations to use and reuse metrics definitions and calculations across different data tools and teams.” Everyone can inspect metrics definitions at will, helping improve transparency and trust in data.
Integrating centralized metrics management with modern data architecture makes it easy to update definitions as business requirements evolve and then propagate them across the organization. This improves both scalability and collaboration, as the whole organization speaks the same data “language” without gaps or misunderstandings.
Metrics stores are built to integrate natively with open APIs, making it possible to surface metrics in the workflows and apps where LOB users need them most. Moreover, headless BI infrastructure enables real-time and near real-time updates, helping to keep decision-making relevant and informed.
A metrics layer is also a boon for software engineers. Because it translates metric definitions into code, it helps tech teams follow established best practices, such as version control, tracking and the DRY (don’t repeat yourself) principle. This increases efficiency and reduces repetitive work.
Metrics creation is advanced analytics’ crucial ingredient
Robust metrics creation is the glue that holds true advanced BI solutions together. Without this use case, data would languish unused, metrics would diverge across the organization, teams would struggle to coordinate and insights would arrive too late or not at all.
FAQs:
What is a metrics layer?
A metrics layer is a centralized data modeling layer that defines consistent business metrics across different tools and teams. It ensures everyone uses the same logic and calculations for analysis and reporting.
Why does a metrics layer matter for business analytics?
A metrics layer ensures consistency and accuracy in business analytics by standardizing metric definitions, reducing errors and enabling faster, relevant insights across teams. Without metrics creation, data would become confused and trust would drop.
What are the business benefits of a metrics layer?
The business benefits of a metrics layer include:
- Consistent and accurate metrics across tools
- Faster decision-making with trusted data
- Minimal manual errors and duplicated logic
- Improved collaboration between data and business teams
What are the use cases for a metrics layer in enterprise analytics?
Use cases for a metrics store in enterprise analytics include:
- Different teams can collaboratively define, refine and use metrics
- Consistent, real-time metrics for executive dashboards and operations
- Uniform financial metrics for accurate reporting and forecasting
- Centralized customer, product and HR metrics for deeper analysis
- Headless commerce and supply chain optimization with API-driven, consistent metrics
- A single source of truth for metrics used in regulatory compliance reporting and internal audits
This article is published as part of the Foundry Expert Contributor Network.
Want to join?
Can your cloud provider really scale? 15 Aug 2025, 11:00 am
On July 29, 2025, enterprises relying on Microsoft Azure’s East US region experienced an unexpected disruption that reverberated across numerous organizations. Attempted allocations for virtual machines failed. The root cause wasn’t a network breach, misconfiguration, or other complex technical mishap. It was something shockingly basic: a lack of capacity. A sudden surge in demand outstripped the available computing resources, rendering Azure unable to fulfill virtual machine requests for several users. Although Microsoft flagged the issue as resolved by August 5, numerous administrators reported lingering challenges, highlighting a deeper problem with the “elastic” cloud solutions we’ve come to trust.
This Azure incident wasn’t an anomaly. In the past few years, such capacity-related outages have become more prevalent, impacting various public cloud providers. Enterprises were assured that cloud environments were engineered to scale automatically and effortlessly, capable of handling unpredictable spikes in demand without issue. But recent reality checks, including this Azure crisis, suggest otherwise.
Organizations are increasingly finding themselves grappling with the hard truth: The public cloud isn’t some magic infrastructure immune to the challenges of physical systems; the cloud is simply someone else’s computer, with all the usual limitations, pitfalls, and infrastructure constraints. Enterprises must recognize this and account for the possibility—the inevitability—of failures in scalability.
Promises of endless scalability
Public cloud providers built their reputations on a simple yet powerful claim of instant scalability up or down in response to user demand. Need more computing power to handle a traffic spike? No problem! Just allocate more virtual machines. The seamless flexibility offered by Microsoft Azure, Amazon Web Services (AWS), Google Cloud, and others was a major selling point for enterprises transitioning away from on-premises data centers. Companies reasoned that offloading infrastructure management to hyperscalers would grant them access to virtually limitless computing power while eliminating headaches related to hardware provisioning.
The Azure East US region incident underscores a serious flaw in this narrative. “Limitless capacity” falls apart when demand exceeds supply. Cloud providers, while expansive in scale, still rely on physical data centers with finite infrastructure. When a region’s compute resources are exhausted, virtual machine allocation simply fails, leaving enterprises scrambling for alternative solutions. This time, the issue stemmed from surging demand for certain types of compute instances, likely compounded by enterprisewide Kubernetes upgrades coinciding with the end-of-life timeline for Kubernetes 1.30. These overlapping pressures likely overwhelmed the system.
Scalability in the cloud isn’t inherently limitless. When we talk about elasticity, what we really mean is the capacity to scale within the confines of available infrastructure—an infrastructure that, at the end of the day, is still constrained by physical hardware and resource limitations.
Holding providers accountable
As cloud capacity challenges continue to emerge, enterprises must reassess how they engage with public cloud providers. The first step is a renewed focus on service-level agreements (SLAs). For years, SLAs have served as a measure of trust between cloud providers and their customers. These agreements outline performance metrics such as uptime, latency, and response times. However, metrics like “available capacity” or “scalability thresholds” are rarely addressed explicitly in standard contracts, leaving enterprises without a clear recourse when capacity issues arise.
Enterprises should revisit their SLAs and consider stricter requirements. A well-drafted SLA should include clauses that address failure to allocate resources and enforceable commitments related to scalability, geographic availability, and redundancy. Compensation for falling short of these guarantees must also be outlined, whether in the form of monetary payments, service credits, or some combination.
Enterprises should also insist on telemetry visibility: consistent, clear insights into cloud resource usage and availability. Monitoring tools alone aren’t enough if the cloud provider does not transparently communicate overall capacity trends and projected constraints. Customers using the Azure East US region, for instance, would have greatly benefited from earlier warnings that demand in certain instance classes was exceeding availability. Microsoft suggested using alternative instance types or migrating workloads to East US 2, but many enterprises learned of these options far too late, after their operations had already been disrupted.
Responding to failure in the cloud age
Capacity issues will almost certainly arise again. The question is how enterprises will respond and adapt. Enterprises must treat the cloud not as a perfect, endlessly scalable solution, but as normal infrastructure subject to failure and constraints. They should pursue practical steps, including the enforcement of robust SLAs, diversification of workloads across multiple regions or providers, and internal contingency plans for capacity-related failures.
Organizations should also consider hybrid or multicloud strategies to mitigate risk. By spreading workloads across multiple providers or maintaining a baseline capacity in private data centers, enterprises can ensure that critical operations remain insulated from capacity constraints on any one platform. This hybrid model, though more complex, recognizes that no single provider can always meet 100% of a company’s compute needs.
The cloud computing industry must address this growing trust gap around scalability. Providers need to increase transparency about capacity constraints and communicate more proactively during demand surges. Customers should feel confident that even when workloads demand rapid scaling, they won’t encounter unexpected resource allocation errors.
Ultimately, the Azure East US region incident serves as a wake-up call to enterprises and providers alike. Although the cloud offers unprecedented flexibility, scalability is not an abstract, automatic guarantee; it’s a shared responsibility that must be actively negotiated, prepared for, and enforced through clear accountability. If the promises of elastic computing are to remain credible, the industry must embrace greater transparency, accountability, and collaboration with its customers.
The truth about Python’s AI-powered popularity surge 15 Aug 2025, 11:00 am
Python’s popularity is surging thanks to AI, but also its power and ease of use. Editable installs for Python packages and the newly refined type hinting in Python 3.14 are just two examples, and the brand new, in-beta installation manager also helps. We get you started with all three—and more—in this week’s Python Report.
Top picks for Python readers on InfoWorld
Python popularity boosted by AI coding assistants: Tiobe
Python and AI together make a power duo, with each driving the popularity of the other. Python’s ranking in the Tiobe index continues to climb, and AI is one of its biggest use cases. (But wait—do we also spy Perl making a surprise comeback?)
How to use editable installs for Python packages
Ever wished you could edit Python packages installed locally without reinstalling them? Let Python’s editable installs point the way.
Get started with Python type hints
Type hints in Python are optional, but add new levels of readability and automated linting for correctness. Learn how annotations work, including the powerful lazy evaluation features added in Python 3.14.
Quick-start guide to the new Python Installation Manager
Installing, managing, and updating Python installations on Microsoft Windows just got a whole lot easier. Here’s how to get started with the Python Installation Manager, currently in beta.
More good reads and Python updates elsewhere
PEP 798: Unpacking in Comprehensions
Take a look at this newly proposed Python feature, which would allow an easy syntax for unpacking iterables in a list/set/dictionary comprehension.
PEP 802: Display Syntax for the Empty Set
Here’s another new Python feature proposal: A syntax for empty sets that’s more concise (and consistent) than set().
UV patches a dangerous ZIP-handling issue
The team behind uv patched an issue that would have allowed delivery of malicious payloads via a specially crafted .zip archive. Fortunately, the issue was never exploited.
The design of the Numba v2 compiler
Numba uses JIT compiling, powered by LLVM, to generate fast math code. Previously, if you wanted to make sense of Numba’s internals, you had to trudge through the source code. Now, this in-progress online book walks you through the details.
Wassette: A bridge between Wasm and MCP 14 Aug 2025, 11:00 am
Microsoft’s fascination with AI agents as a tool for developers continues with Wassette, a new open source release from its Azure Core Uptime team. Built in Rust and designed to host pieces of functionality written as WebAssembly Components, it’s a first step to delivering customizable and composable functionality that can be deployed as a tool for a local agent—in this case, the GitHub Copilot agent running in Visual Studio Code or any other Model Context Protocol-aware agent.
Wassette is, at heart, relatively simple. It loads and runs components, sandboxing them using the familiar Wasmtime runtime, and provides an MCP interface by translating their interfaces to MCP functionality. Using Wassette and a mix of your own and public WebAssembly components, you can quickly assemble a library of secure tools tailored to a specific project.
Working with Wassette in VS Code
Getting started is simple enough. Although I had trouble running the Arm version of Wassette both in Windows and in Linux, the X64 version worked the first time. Windows users can install using WinGet. Linux users can use curl and an install script. Other options include Homebrew support or using Nix to set up a development shell with Wassette.
One minor issue did arise: A false positive virus detection in Windows Defender meant I had to temporarily disable my antivirus tools to complete the WinGet-based install. There is a related GitHub issue noting that the development team is working to register Wassette’s signature to avoid this in the future.
Once installed, you need to register the Wassette MCP server with your developer tool. Microsoft provides instructions for Visual Studio Code, Cursor, Claude Code, and Gemini CLI. I did find that the script the documentation suggested for VS Code failed, and I had to install MCP manually using the tool built into VS Code’s GitHub Copilot Agent UI. This required having to reinstall each time I restarted VS Code. Hopefully an updated version of the Wassette tool will fix this. It’s not a dealbreaker, but it is a bit awkward to repeatedly reload it.
When the Wassette MCP server runs inside the GitHub Copilot Agent, you can start to use it. It will appear as another tool alongside other registered servers. You should note that if you have more than 128 tools registered in GitHub Copilot it can be slow to select the right tool for your prompt.
The documentation provides a link to a basic time client that extends the base GitHub Copilot functionality. From the GitHub Copilot chat UI, I was able to load this from a remote OCI registry. The agent selected the Wassette MCP server and loaded the WebAssembly component. I could then use it to get the current time, a feature the base agent was unable to offer.
An extensible, secure MCP server
Getting the time may seem to be a relatively trivial feature to add to the GitHub Copilot agent, but it’s only an example of what you can do with Wassette. This is an extensible platform; if a feature isn’t available, you can quickly write your own and add it. The added bonus of running in a WebAssembly sandbox reduces risk by isolating modules from each other and from the OS and the IDE.
Much of the security model comes from Wasmtime, as it builds on a least-privilege model. A component loaded into Wassette must have explicit permissions for the services it needs, and it uses the agent chat interface to request them as needed. For example, a component that needs network access will request permission for each specific domain it connects to. This ensures that a module that gets the time from your PC’s lock won’t send your application keys to a nefarious domain. If it requests network permissions when you aren’t expecting them or for a domain you didn’t request, you can use the agent to block it.
Microsoft has provided a set of sample tools to show what can be done with Wassette. They’re all WebAssembly components, written in a selection of different languages. These include Python, JavaScript, Rust, and Go. If there’s Wasmtime support for a language, you can build a component with it, ready for use in Wassette.
Adding features with WebAssembly components
It’s important to understand that you don’t need to do anything with a WebAssembly component to use it with Wassette. I’ve previously described the Model Context Protocol as a modern equivalent of tools like CORBA’s Interface Definition Language, as it takes APIs and other interfaces and wraps them in an agent-ready description with a common way of sending and receiving information.
Wassette does this by taking advantage of one of the key features of WebAssembly components: the fact that they expose functions as strongly typed library interfaces. Wassette can use any existing (and future) components, giving you eventual access to a wider ecosystem that will add flexibility to your agents.
The key to this approach is how WebAssembly components interact with the Wasmtime framework, using WebAssembly Interface Types. This exposes typed functions and interfaces, giving you limited and controlled access to the component. If a component requires a string, it will only accept a string. You can also have multiple components written in different languages, all compiled to Wasm and running in the same Wassette host.
You don’t need to learn anything new to build a component interface. They are implemented using the standard interface model in the language you choose before compiling to Wasm and storing in an OCI registry. Interfaces can support multiple operations, and the ByteCode Alliance provides tools to help build components in its GitHub repository.
It’s not hard to write WebAssembly components, and once you start taking advantage of WASI, you can build in local file system and network features, which can be controlled using the Wasmtime permissions framework through Wassette. If you need to add a feature to an agent to provide deeper grounding in actual data, this is one of the most efficient and straightforward ways to expose it via MCP securely.
What’s next for Wassette?
This is an initial release and features are obviously missing. Perhaps the most important is the lack of a discovery feature, both for OCI registries and the WebAssembly components stored in them. For now, if you need a specific component, you need the right OCI URI. As Wassette is an open source project, you can get involved in its development on GitHub.
With Wassette initially targeting developer-focused agents, there’s no real reason it can’t be part of any agent platform that uses MCP. You could use it on a customer service platform, with components that extend your CRM platform into other applications or anywhere that needs functionality that isn’t provided by the core MCP servers you’re using. It’s especially useful when those required functions are small and don’t require much code but still need to be secure with tightly controlled access to resources.
It’s interesting to see a tool like this early in the life of modern AI agents. The combination of discoverable modular code that runs in your local context, along with the ability to quickly add new extensions, reminds me of the work that went into developing agent frameworks like Kaleida back in the 1990s. Today, we can build them on a platform with a local sandbox and we don’t need to learn a whole new language. With Wassette we can develop and deploy the features we need to see in an MCP server, installing them only when needed.
Monitoring microservices: Best practices for robust systems 14 Aug 2025, 11:00 am
Microservices architecture, while offering exceptional agility and scalability, introduces a new layer of complexity in terms of tracking. Gone are the times of monolithic applications where a single set of logs ought to tell you the whole tale. In a distributed environment, knowing the health and performance of your machine requires a sophisticated method. Efficient microservice monitoring isn’t always about gathering data; it’s about restructuring those records into actionable insights.
So, how do you efficiently maintain a focus on your complex web offerings? It all boils down to a mixture of standardized observability practices and the right tooling.
Standardized observability: The foundation of understanding
Imagine trying to debug a conversation where everyone speaks a different language. That’s what it’s like trying to monitor microservices without standardized observability. To reap clarity and correlation, it’s vital to set up steady practices throughout all of your services for:
- Logging. Implement a pre-defined logging with a well-known format (e.g., JSON). This ensures that logs from distinctive offerings are easily parsable and searchable, and provides quicker identification of issues. Include essential records like timestamps, provider names, log levels and unique request IDs.
- Distributed tracing. When a request flows via multiple services, distributed tracing presents a detailed view of its journey. Adopt a general tool like OpenTelemetry to instrument your offerings. This allows you to visualize the flow, identify latency bottlenecks in specific provider calls and recognize dependencies. Using tools like middleware, Grafana, etc, which continuously integrate Otel with different service providers, so more people can benefit from Otel and have a deep understanding of their log level data.
- Metrics. Define a standard set of metrics (e.g., request count, error rate, latency) with proper naming conventions throughout all services. This enables you to evaluate performance metrics across unique additives and construct complete dashboards.
A unified observability stack: Your central command center
Collecting extensive amounts of telemetry data is most beneficial if you can combine, visualize and examine it successfully. A unified observability stack is paramount. By integrating tools like middleware that work together seamlessly, you create a holistic view of your microservices ecosystem. These unified tools ensure that all your telemetry information — logs, traces and metrics — is correlated and accessible from a single pane of glass, dramatically decreasing the mean time to detect (MTTD) and mean time to resolve (MTTR) problems. The energy lies in seeing the whole photograph, no longer just remote points.
Continuous tracking and dependency mapping: Understanding behavior
Once your observability stack is in place, the real work of monitoring begins. Continuously capturing key overall performance signs (KPIs) to monitor the real-time performance of your device:
- Service health. Monitor the uptime and availability of every individual service. Proactive health checks can regularly discover issues before they affect customers.
- Latency. Track the time it takes for requests to be processed by each provider. High latency can indicate bottlenecks or overall performance troubles. Drill down to specific inner calls contributing to the delay.
- Error rates. Monitor closely the wide variety of errors generated with the aid of every request. Spikes in error rates regularly signal underlying problems, requiring immediate research into the type and frequency of errors.
- Inter-service dependencies. It maps out how your services interact with each other. Understanding these dependencies is essential for pinpointing the root cause of issues that might propagate through your system. Through automated discovery and visualization of these dependencies, we can reduce the radius of any failure.
Meaningful SLOs and actionable alerts: Beyond the noise
Collecting information is good, but acting on it is better. Define significant service level objectives (SLOs) that replicate the predicted performance and reliability of your offerings. These SLOs need to be tied to enterprise desires and customer experience, ensuring that your monitoring immediately contributes to enterprise success.
Based on your SLOs, install actionable indicators that:
- Avoid noise. Don’t send an alert on each minor change. Configure alerts to trigger only when deviations from your SLOs are sizable and require immediate attention, thereby preventing alert fatigue in your on-call teams.
- Enable rapid incident response. Alerts need to provide enough context (e.g., service name, error type, relevant metrics, linked traces) to allow your crew to apprehend the issue and start troubleshooting quickly. Integrate alerts with your incident management tools for seamless workflow and automatic escalation.
Enhanced root cause analysis: Contextual debugging
When an incident takes place, time is the main thing. Efficient root cause analysis is important. Leverage the energy of your standardized telemetry:
- Trace context. Use trace IDs and span IDs from your disbursed tracing machine to attach logs and metrics to particular requests. This allows you to comply with a single request’s path through multiple services and quickly identify where it failed or experienced overall performance degradation. This gives detailed visibility and dramatically reduces debugging time.
- Correlation IDs. Implement correlation IDs that are passed through all services for a given request. This allows you to easily search and filter logs and metrics associated with a selected user intersection or commercial enterprise transaction, providing a holistic view for debugging. This is beneficial for tracing complicated enterprise flows.
By combining trace context and correlation IDs, you enable automated and contextual debugging throughout the whole microservices architecture, reconstructing a frightening challenge into a streamlined method. This technique is the most effective, as it allows you to repair issues quickly but also provides insights for proactive system improvements and overall performance optimizations.
A strong and resilient microservices structure
Monitoring microservices effectively is an ongoing journey that requires a commitment to standardization of data, using the right tools and a proactive mindset. By utilizing standardized observability practices, adapting a unified observability stack, continuously monitoring key metrics, placing meaningful SLOs and allowing enhanced root cause analysis, you may construct a strong and resilient microservices structure that truly serves your business desires and delights your customers. Don’t just accumulate data; instead, use it to understand, count on and solve problems before they impact your customers.
This article is published as part of the Foundry Expert Contributor Network.
Want to join?
Claude Sonnet 4 upgrade enables full codebase processing in a single request 13 Aug 2025, 1:09 pm
Anthropic has expanded the capabilities of its Claude Sonnet 4 AI model to handle up to one million tokens of context, five times its previous limit, enabling developers to process entire codebases or large document collections in a single request.
The upgrade, now in public beta via Anthropic’s API and Amazon Bedrock, aims to support more complex use cases such as large-scale code analysis, large-scale document synthesis, and context-aware AI agents, with Google Cloud’s Vertex AI integration expected soon.
Anthropic’s move comes as rivals OpenAI and Google market their own AI models with similar context limits, underscoring the race among major providers to handle larger and more complex workloads.
The longer context window removes a key bottleneck for AI-assisted programming by allowing entire projects to be processed at once. Developers no longer need to split large codebases into smaller pieces, reducing the risk of missing links between related components.
Development workflows and staffing
Processing entire codebases in a single AI request could reshape enterprise software development, altering workflows and potentially affecting team structures.
Analysts point out that two trends are driving this shift: model developers are expanding context windows to handle more tokens at once, and AI systems are becoming more capable of accurately processing and reasoning over large volumes of code.
“With expanded context windows, enterprises can potentially accelerate their development and debugging at scale,” said Neil Shah, vice president for research and partner at Counterpoint Research. “Over time, as models become more proficient in generating, validating, and refining boilerplate code, enterprise-grade quality output would be the north star. This gives the enterprise time-to-optimize and time-to-market advantage.”
These performance gains could also change the very nature of a developer’s role, according to Oishi Mazumder, senior analyst at Everest Group.
“Long-context AI moves development from piecemeal assistance to holistic collaboration, turning developers into code orchestrators who direct end-to-end changes across entire systems,” Mazumder said. “This restructuring enables smaller, specialized teams to deliver enterprise-scale projects faster, with gains in onboarding speed, code quality, and delivery pace. The biggest staffing shift will be toward AI-augmented engineers and governance roles, as repetitive coding tasks increasingly move to the AI.”
Security, compliance, and IP risks
AI systems gaining the ability to retain and analyze vast amounts of sensitive code or documents in a single operation could introduce new security, compliance, and safety risks.
“The ability to process entire codebases in one request sharply increases the scale of potential exposure,” Mazumder said. “A single breach could reveal complete system architectures, embedded credentials, and security vulnerabilities at once. Large-context retention also raises compliance risks, as regulated and unregulated data may be mixed, and safety risks, as the AI’s full-system view could be exploited to identify or generate malicious code changes.”
Handling large context inputs adds further complexity, as models process and learn from vast numbers of tokens, said Shah.
“This raises concerns regarding intellectual property (IP) in the generated code, similar to ongoing discussions about AI’s impact on the music industry, where originality and IP rights are sometimes uncertain,” Shah added.
Hands-on with Svelte: Build-time compilation in a reactive framework 13 Aug 2025, 11:00 am
Svelte introduced the idea of using a compiler to optimize and transform specialized syntax into front-end components. The idea has caught on with a variety of frameworks, including React. In this style of reactive development, using a compiler lets the framework be more flexible and streamlined in its definitions. Svelte, the originator, uses the idea to full advantage. The resulting syntax is also incredibly smooth.
What developers love about Svelte
When it comes to code, less is more. As an industry, we’re learning this the hard way with AI, which will happily spew forth reams of code, when what we most want is something tightly focused with contextual understanding. Svelte honors the “less is more” principle by giving you the cleanest syntax possible. This results in less mental burden and systems that are easier to maintain. Svelte is also fast, full-featured, and has a welcoming open source community.
Svelte gets much of its power from its compiler. Svelte can be very aggressive with its syntax because the compiler transforms the code into something browser-specific before sending it over the wire. This compilation step also means that Svelte can optimize your code and components extensively; in fact, much of that work is done on the server rather than the client. Whereas a framework like React sends component code to the browser to be run, Svelte transforms it into direct DOM manipulation operations that are run in the browser.
Using a compiler does require having a build for your project, but that is true for almost all projects these days. Svelte’s team also developed SvelteKit, which provides an ordained path for creating and managing Svelte-based apps. SvelteKit has a ton of power to it and greatly simplifies handling the server-side elements of a real-world application.
Setting up a Svelte build
Let’s jump right in and set up a simple build environment with Svelte. From the command line, enter:
$ npx sv create
This launches an interactive creator. The creator immediately demonstrates the power and flexibility of SvelteKit, including support for TypeScript, vanilla JavaScript (which we’re using for this demo), and several integrations, including testing frameworks. We’ll use a bare-bones setup for this demo, focusing on Svelte.
When it’s ready, run the project in dev mode with: $ npm run dev -- --open. You can now visit the basic page at localhost:5173.
File-based page routing
Since we’re focusing on Svelte, and not SvelteKit, we won’t dig deeply into the routing and other SvelteKit features. The main thing to note is that Svelte does default file-based routing, similar to Next.js. In our case, the main page is served from:
src/routes/+page.svelte
Unlike Next, Svelte prepends a + to the page name. This indicates clearly that it is an active route file, rather than a utility or component file. Right now, there’s just a link in there, so let’s put something interesting in. I’m currently on a streak of watching psychedelic, mind-bending movies, and let me tell you, there are some wild ones. Let’s do a simple listing of some of them using Svelte and an in-memory array. We can put this code into +page.svelte like so:
Weird Movie List
{#each mindBendingMovies as movie (movie.id)}
-
{movie.title}
Directed by {movie.director} ({movie.year})
{#each movie.themes as theme}
{theme}
{/each}
{/each}
The first thing to notice about the page is how minimalist it is. The three sections—script, style, and markup—represent each essential aspect of the UI. This page will become a Svelte component, with those elements driving its behavior.
Here’s a look at the page so far:

Matthew Tyson
The only script we need right now is the definition of the mindBendingMovies array. We loop over the array in the markup: {#each mindBendingMovies as movie (movie.id)}. The relevant contents are displayed using the exposed iterator variable, movie.
Template expressions
Anytime you see the curly braces in Svelte, you are looking at a template expression. This syntax lets you access JavaScript variables and functions declared in the script section, as well as Svelte’s streamlined JavaScript-like syntax. You can see it in action here, with the #each loop.
Next up, movie.id serves as the “key.” Even if you don’t explicitly use a key, it’s a good idea to provide one (other than the array index) so that Svelte can intelligently manage updates to the list display. Using key expressions in each blocks is common to all reactive libraries.
All the markup inside the #each block will be invoked for each iteration of the loop. This syntax is very clean: no using the map function and passing in an anonymous function. The indentation makes sense and is clear. The inner loop on movie.themes is equally obvious, with no unnecessary clutter in our templates. This elegance is one of Svelte’s best features.
Reactive sorting in Svelte
Now let’s say we want to allow users to sort the list dynamically, based on each movie’s weirdness factor. Svelte makes the process painless. We begin by adding a wierdnessFactor to each movie entry. Then, we need a sortOrder property and a sortMovies function:
One thing to notice is that we need to reassign mindBendingMovies to the newly sorted array, rather than inline sorting it. That’s because Svelte watches for changes to the top-level references only, not the internals of the array. Otherwise, it is standard JavaScript that will order the array by its weirdnessFactor using either the ‘asc’ or ‘desc’ sortOrder.
The main thing we need to add to the template is a button to toggle the sortOrder variable:
On:click is Svelte’s syntax for a button-click handler, and calls the sortMovies function we just saw. We also use sortOrder inside a template expression and a ternary operator to display a message showing the toggle state.
I also added an output for the weirdness rating of each movie:
Weirdness Factor: {movie.weirdnessFactor} / 10
And I updated the styling, so we get something like this:

Matthew Tyson
Naked Lunch is a strange movie, indeed.
Svelte’s reactive filtering
Filtering will give us a chance to look at two more awesome features in Svelte: two-way binding and derived reactivity.
Two-way binding
Two-way binding lets you tie an input component to a variable so that if either one changes, the other is updated. We can use it to accept a filter term. First, let’s add the actual input component to the template:
let searchTerm = '';
Now we can bind that to an input control:
The bind:value property does the two-way work for us; whatever happens to searchTerm and its input will be synchronized.
Derived reactivity
Now, we need a way to modify the list, and here comes more Svelte magic:
$: filteredMovies = mindBendingMovies.filter(movie => {
    const lowerSearchTerm = searchTerm.toLowerCase();
    return movie.title.toLowerCase().includes(lowerSearchTerm) ||
           movie.director.toLowerCase().includes(lowerSearchTerm) ||
           movie.themes.some(theme => theme.toLowerCase().includes(lowerSearchTerm));
  });
This function uses the standard filter operator to drop any movies that don’t have matching content for the searchTerm. But the way it’s declared, with the $: syntax (a “reactive declaration”), is special to Svelte. This declaration ensures that with any change to a variable the reactive variable depends on, the engine will update it by executing the function.
In this example, filteredMovies depends on searchTerm, so whenever that changes, the function will run, and filteredMovies will receive its new value. The filteredMovies variable also depends on mindBendingMovies, so any modifications to that will also result in an update.
The only other thing we need to do is make the display depend on the filtered value:
{#each filteredMovies as movie (movie.id)}
Now we can work on a filter field, which updates the list as the user types:

Matthew Tyson
It’s hard to envision a more concise expression of reactive filtering than these two features together. Notice the sorting still works, and we didn’t have to change anything in the sort code. That’s because the reactive declaration of filterMovies uses mindBendingMovies, so when the sort function changes that, the filteredMovies is updated naturally.
Svelte’s sophisticated filtering gives us exactly what we strive for in reactive code: expressiveness and minimal impact to other parts of the application.
Waiting for async operations
We’ll cover one last feature on this tour: #await, which lets you fire an asynchronous operation and update the display appropriately with minimal fuss.
Say we wanted to let a user click on a movie and fetch its details, then load them in a pane. We’ll use The Open Movie Database and its OMDb API for this demo. (If you are following along, the API requires a free key.) Our pane could look like this:
{#await selectedMovieDetailsPromise}
Loading details...
{:then details}
{#if details.Response === 'True'}
Plot: {details.Plot}
Genre: {details.Genre}
Runtime: {details.Runtime}
Awards: {details.Awards}
IMDb Rating: {details.imdbRating}
{#if details.Poster && details.Poster !== 'N/A'}
 {/if}
{:else}
{/if}
{:else}
No details found for "{selectedMovieTitle}".
{/if}
{:catch error}
Error fetching details: {error.message}
{/await}
Once more, I am omitting some of the surrounding details of the application for brevity, but you can see that #await lets us specify a promise. If the promise is resolved, it will display the results, and if it’s rejected, it will display an error. Here’s the promise itself:
async function fetchOmdbDetails(title) {
    const encodedTitle = encodeURIComponent(title);
    const url = `https://www.omdbapi.com/?t=${encodedTitle}&apikey=${OMDB_API_KEY}`;
    const res = await fetch(url);
    const data = await res.json();
    if (data.Response === 'True') {
      return data; // This will be the resolved value for {#await}
    } else {
      throw new Error(data.Error || 'Could not fetch movie details.'); // This will be the error for {:catch}
    }
  }
The #await block automatically deals with the promise returned from the async function. This function uses the movie title for the ‘t’ argument to the API. The screenshot below shows the movie data displayed in its pane:

Matthew Tyson
Shutter Island is an even weirder DiCaprio vehicle than Inception, if you ask me.
Conclusion
The beauty of Svelte is in its clean feel, and it remains my favorite reactive framework to use. Svelte causes the least friction as a project grows. You can find the code for this demonstration on my GitHub repository.
Page processed in 0.051 seconds.
Powered by SimplePie 1.3.1, Build 20130517180413. Run the SimplePie Compatibility Test. SimplePie is © 2004–2025, Ryan Parman and Geoffrey Sneddon, and licensed under the BSD License.